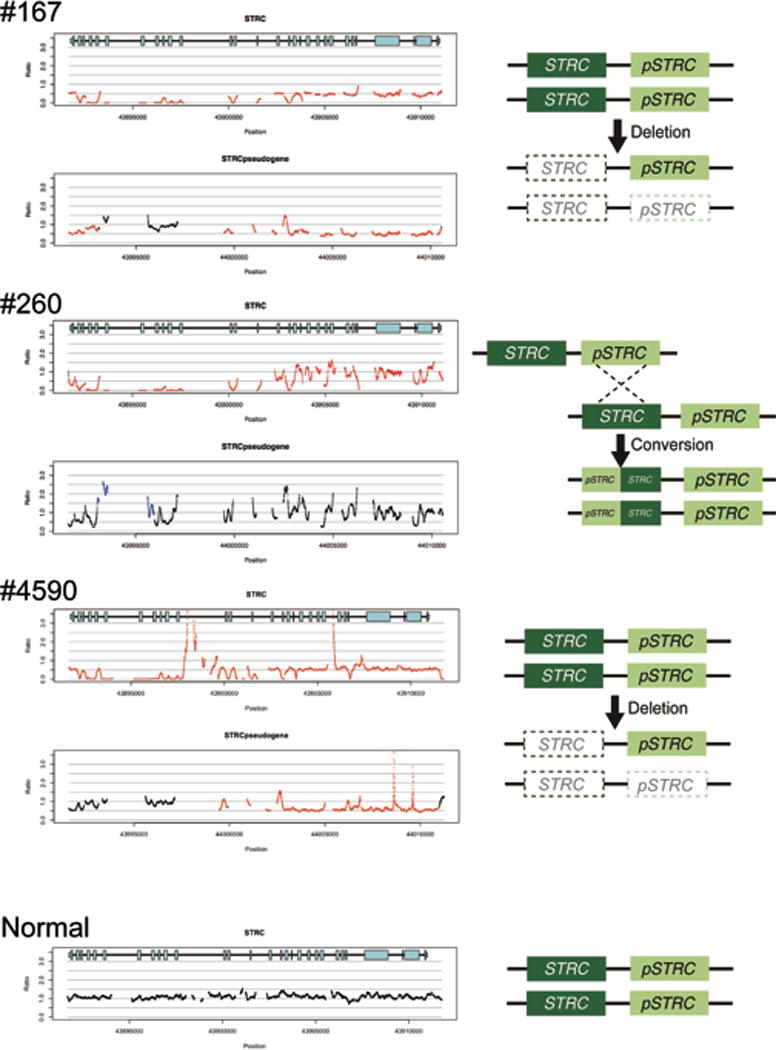
Figure 2.

CNV identification by a CNV-calling script implemented with TGE+MPS. The horizontal axis indicates chromosomal position, and the vertical axis indicates the number of gene copies shown as a ratio; 1.0 indicates the normal 2 copies (black lines), and 0.5 and 0.0 indicates 1 copy (heterozygous deletion) or 0 copy (homozygous deletion), respectively indicated by red lines. Likewise, a figure above 1.0 shows copy gain (heterozygous or homozygous gene duplication) as indicated by blue lines.
A homozygous deletion in the STRC region and a heterozygous deletion in the pseudo-STRC gene (pSTRC) is seen in patients #167 and #4590. A homozygous deletion of the last 11 exons in STRC (left side in the gene diagram) and homozygous duplication of the corresponding region of pSTRC is seen in patient #260. The hypothesized mechanisms for these events are shown to the right.
