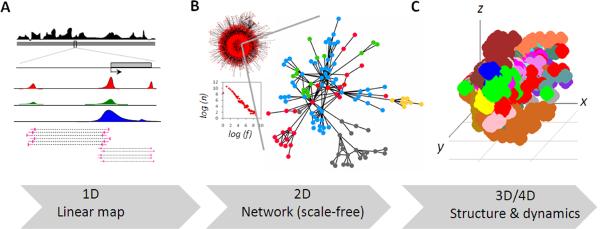
Figure 1.
Progressive transformation of 1D genomic information to 2D interaction networks and to 3D chromatin architecutres. (a) Linear map of genomic and epigenomic data. (b) Chromatin interaction network of Human RNAPII mediated chromatin interaction data and corresponding log-log plot, which is a trademark of scale-free networks. `n' is number of interactions and `f' is fraction of nodes with `n' interactions. An enlarged sub-network, where colors of the nodes represent genomic loci from distinct chromosomes, is shown. (c) A crude 3D space-filled model of human genome reverse engineered from RNAPII mediated chromatin interaction data. Color depicts different chromosomes. (All the data shown here is unpublished data from authors' laboratory)

