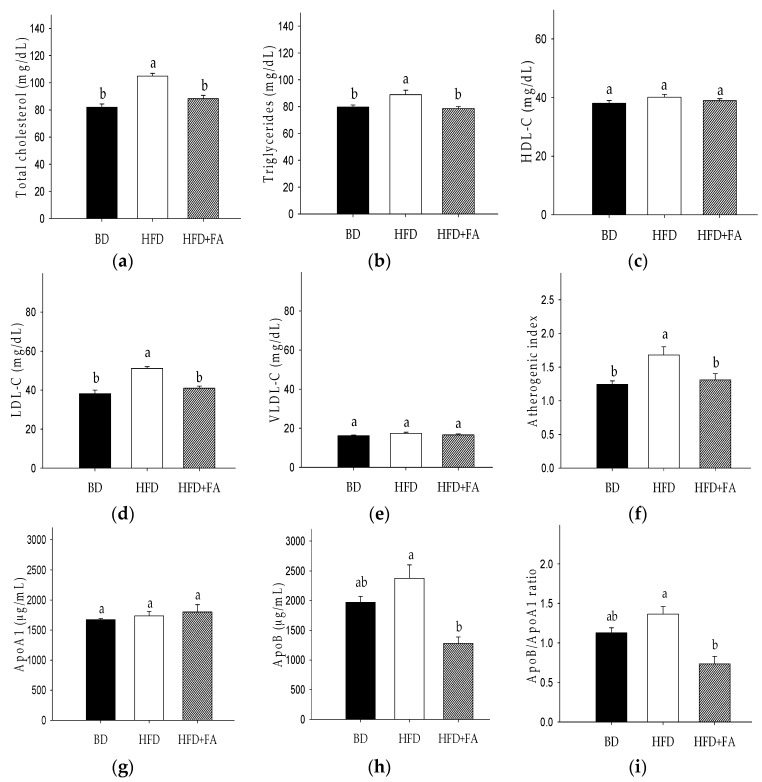
Figure 1.
Effect of ferulic acid on the lipid profile in Wistar rats fed a high fat diet (HFD). (a) Total cholesterol (TC); (b) triglycerides (TG); (c) high-density lipoprotein-cholesterol (HDL-C); (d) low-density lipoprotein-cholesterol (LDL-C); (e) very-low-density lipoprotein-cholesterol (VLDL-C); (f) atherogenic index; (g) apolipoprotein A1 (ApoA1); (h) apolipoprotein B (ApoB); (i) ApoB/Apo A1 ratio. Each bar represents the mean ± SEM. Different letters in the bars represent significant differences (𝑝 < 0.05) between dietary treatments.

