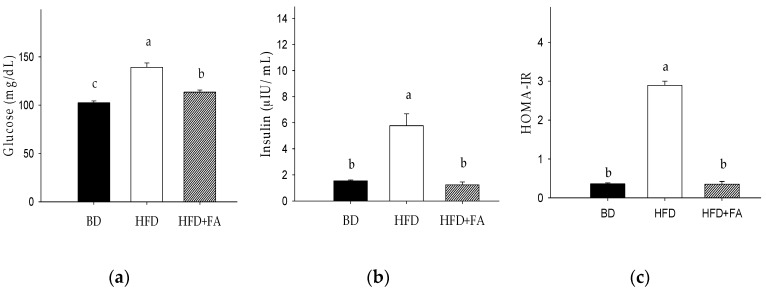
Figure 2.
Effect of ferulic acid on biomarkers of glucose metabolism in Wistar rats fed a basal diet (BD), high-fat diet (HFD), and high-fat diet with ferulic acid (HFD + FA) for 60 days. (a) Glucose; (b) Insulin; (c) Homeostatic model assessment index of insulin resistance (HOMA-IR). Each bar represents the mean ± SEM. Different letters in the bars represent significant differences (𝑝 < 0.05) between dietary treatments.

