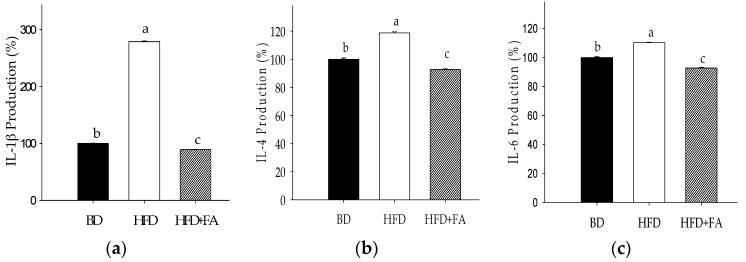
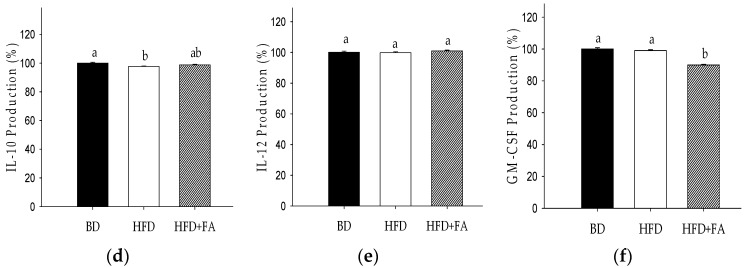
Figure 3.
Production (%) of cytokines in plasma of rats fed a HFD and HFD + FA after 60 days of treatment compared to BD poduction (100%). (a) Interleukin-1β (IL-1β); (b) interleukin-4 (IL-4); (c) interleukin-6 (IL-6); (d) interleukin-10 (IL-10); (e) interleukin-12 (IL-12); (f) granulocyte macrophage colony stimulating factor (GM-CSF). Each bar represents the mean ± SEM. Different letters in the bars represent significant differences (p < 0.05) between dietary treatments.


