Figure 5.
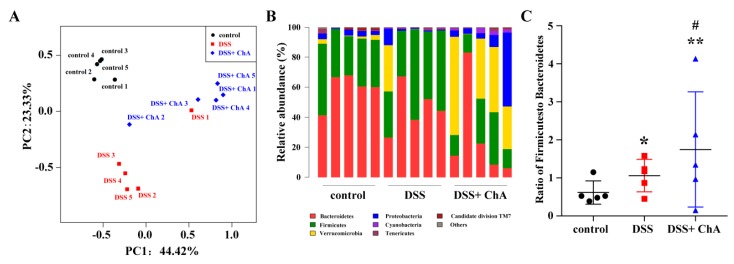
The effects of ChA on microbial composition in DSS-colitis mice. (A) Principal coordinate analysis plot of the fecal microbiota from five cages in each group based on the Bray–Curtis; (B) Relative abundance of bacterial phyla; (C) The ratio of Firmicutes and Bacteroidetes. * p < 0.05, ** p < 0.01, compared with control group; # p < 0.05, compared with the DSS group.

