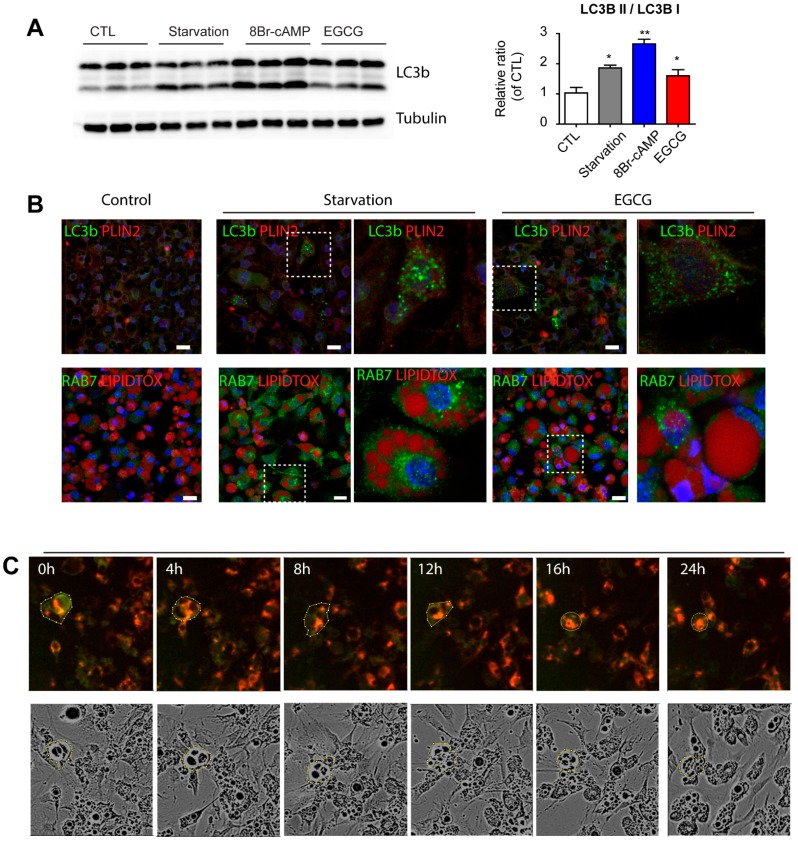
Figure 4.
Effects of EGCG on autophagy responses in adipocytes. (A) Immunoblot analysis of LC3b expression in adipocytes differentiated from C3H10T1/2 treated with starvation medium, 8Br-cAMP (1 mM) and EGCG (10 μM) for 1 day. p values were calculated using the two-tailed unpaired t-test (n = 3, means ± SE; * p < 0.05, ** p < 0.01); (B) Immunofluorescence staining of LC3b/PLIN2 or RAB7/LipidTox in adipocytes differentiated from C3H10T1/2 treated with 8Br-cAMP (1 mM) and EGCG (10 μM) for 24 h. Nuclei were counterstained with DAPI. Bars = 20 μm; (C) Representative images from long-term live imaging of adipocytes expressing LC3B-GFP-RFP reporters treated with EGCG; (D) Time course analysis of GFP/RFP ratio from (C). (E) Flow cytometric analysis of adipocytes expressing LC3B-GPF-RFP reporters treated with ECGC.


