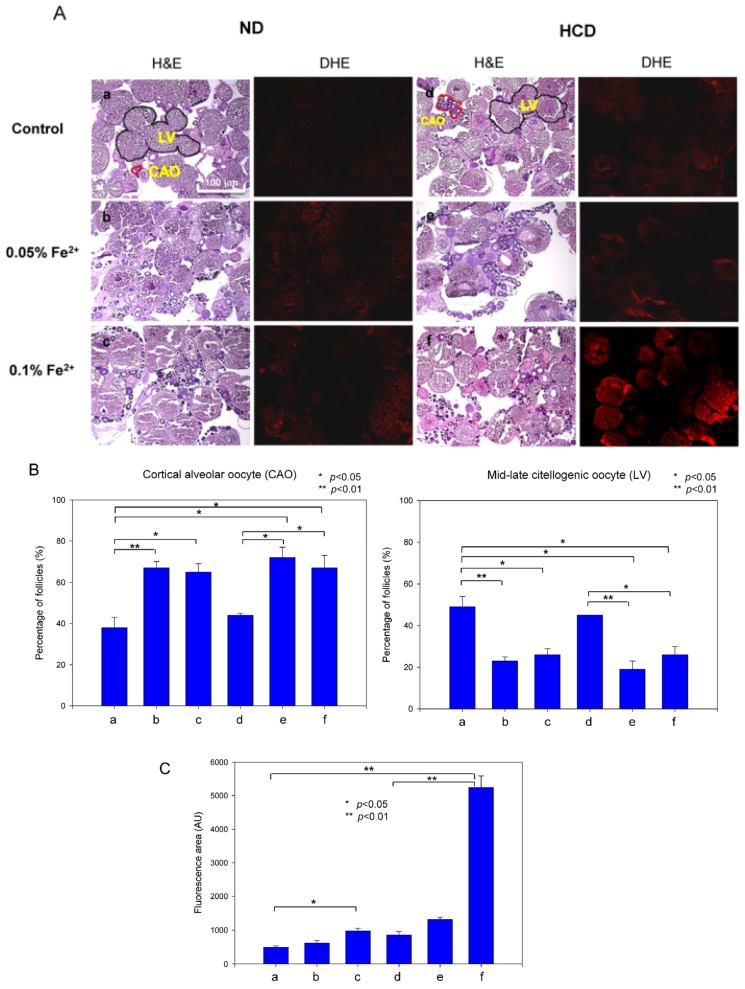
Figure 9.
Histological analysis of ovarian tissue. (A) H & E staining of frozen ovarian tissues from zebrafish fed 0.05% and 0.1% Fe2+ under normal diet (ND) or high cholesterol diet (HCD) for 24 weeks. CAO, cortical alveolar oocytes; LV, Mid-late vitellogenic oocytes (scale bar 100 µm). Reactive oxygen species production at 48 hours post fertilization (hpf) as visualized by DHE staining using quantification of fluorescence (Ex = 588 nm, Em = 615 nm); (B) Graph shows the average value of CAO and LV area. a, ND control; b, ND + 0.05% Fe2+ (wt/wt in diet); c, ND + 0.1% Fe2+ (wt/wt in diet); d, HCD control; e, HCD + 0.05% Fe2+; f, HCD + 0.1% Fe2+. *, p < 0.05; **, p < 0.01; (C) Quantification of DHE stained area by computer-assisted morphometry using Image Proplus software (version 4.5.1.22; Media Cybernetics, Rockville, MD, USA). *, p < 0.05; **, p < 0.01.

