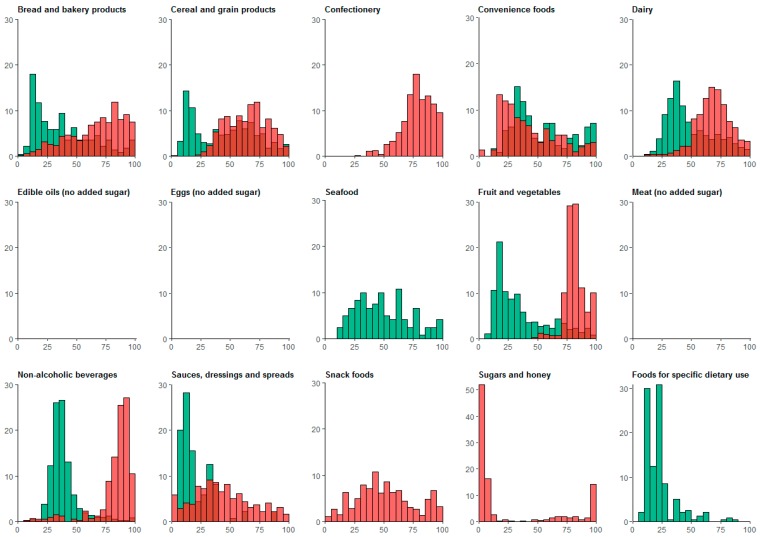
Figure 2.
Added sugar in discretionary (red) and core (green) products, as percentage of total sugar, by food group. Discretionary products are displayed in red and core products are displayed in green. Bars are partially shaded where discretionary and core products overlap. Only products with non-zero levels of added sugar were included.

