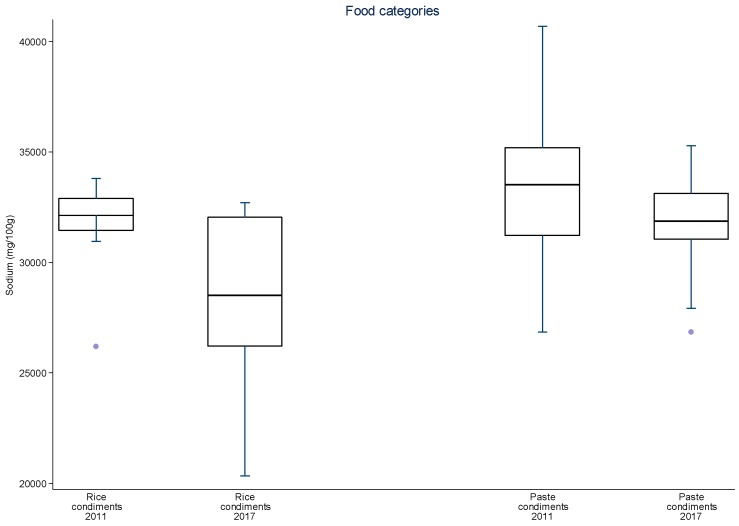
Figure 5.
Distribution of sodium values from baseline to the second data collection for rice and paste condiments. The box displays the interquartile range and the median value is marked as a line within the box. The lines extending above and below the box indicate the most extreme value within the 75th percentile + 1.5x (interquartile range) and the 25th percentile − 1.5x (interquartile range), and additional values outside of this range are marked as grey circles.

