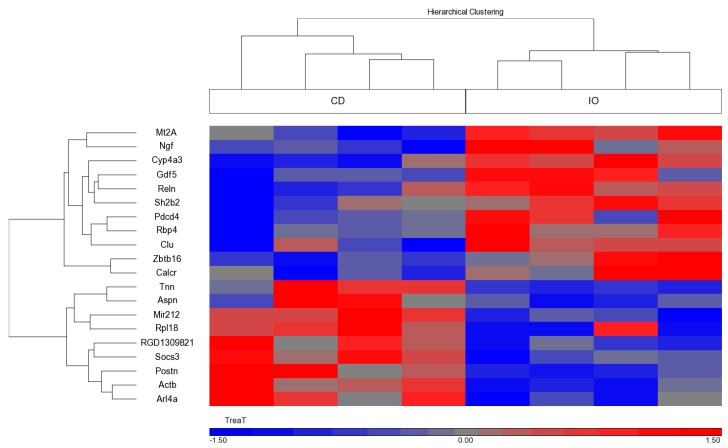
Figure 3.
Differential gene expression in the EGP according to Rat Affymetrix Gene Chip expression array (Rat Gene 2.X ST, Affymetrix, Thermo Scientific) (n = 4 per each group). Heatmap of the genes that were differentially expressed in EGP in the Infat Oil (IO) versus the Control Diet (CD) fed animals (p < 0.05 and FC = 1.5). The heatmap was created using Partek GS.

