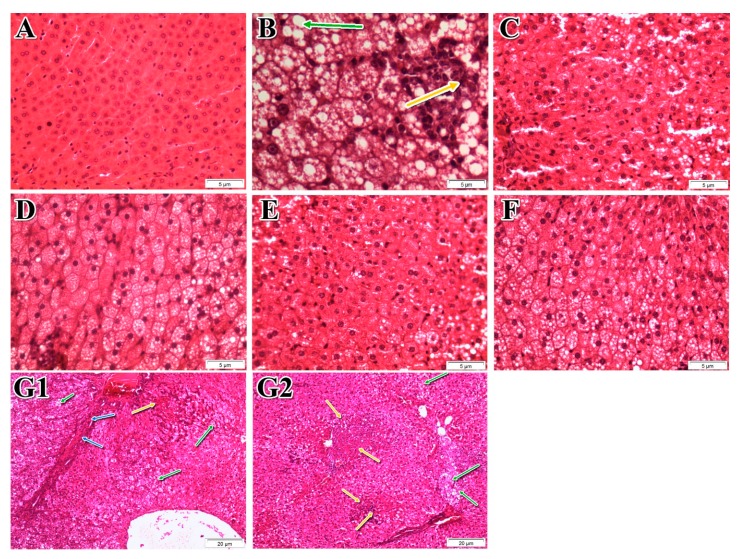
Figure 4.
Effect of P. niruri extracts and metformin on the histological evaluation of liver biopsy. Typical liver tissue sections (400×) stained with haematoxylin and eosin (H&E). (A) NC group, showing normal tissue structure and architecture with no steatosis; (B) HFD group showed vesicular steatosis and inflammation (typical NAFLD); (C) HFD + metformin (500 mg/kg); (D) HFD + WE (1000 mg/kg); (E) HFD + 50% ME (1000 mg/kg) and (F) HFD + ME (1000 mg/kg). The severe hepatic damage (inflammation and fibrosis) in HFD rats is further shown in the Figure 4G1,G2 (100×) stained with haematoxylin and eosin (H&E), (G1) HFD group showed steatosis (green arrows) with fibrosis (blue arrows) (100×); (G2) HFD group showed lobular inflammation (yellow arrows) (100×).

