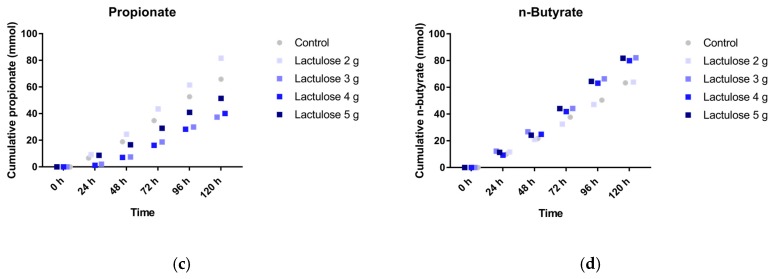
Figure 2.
Production of (a) total short chain fatty acids (SCFA); (b) acetate; (c) propionate; and (d) butyrate in TIM-2 runs (mean of n = 2 (Lactulose dosages) or n = 4 (control)) with different dosages of Lactulose. Values at the start of the test period were set to zero. All data points shown at the proximity of the individual time points indicated at the X-axis belong to these specific time points.


