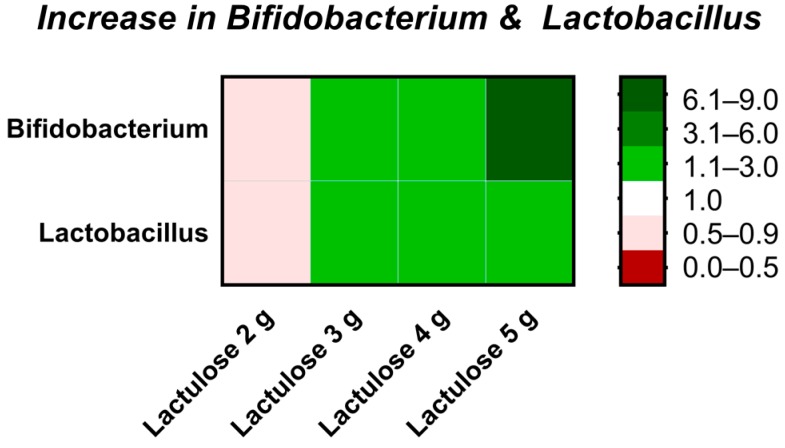
Figure 6.
Heat map depicting fold changes of the increase in Bifidobacterium and Lactobacillus at different Lactulose doses compared to control after the 120 h test period in TIM-2 runs. A value equal to 1 (white) indicates no change, a value of >1 (green) indicates an increase, a value of <1 (red) indicates a decrease of the microbial genera.

