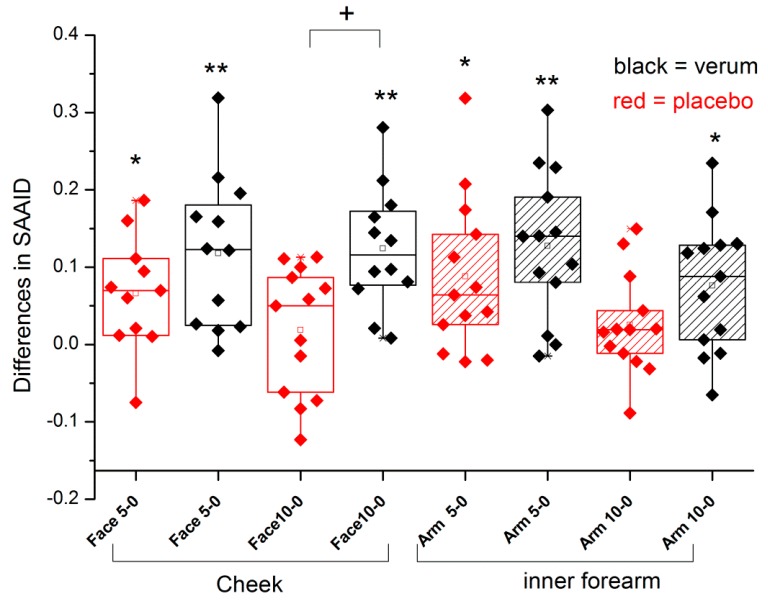
Figure 2.
Box plot of the differences of SAAID to the initial values measured at the cheek and inner forearm. + p < 0.05 between placebo and verum; * p < 0.05, ** p < 0.01 to initial value. The box presents 50% of the data. The bottom and top of the box are always the first and third quartiles and the solid line box is always the second quartile, the median.

