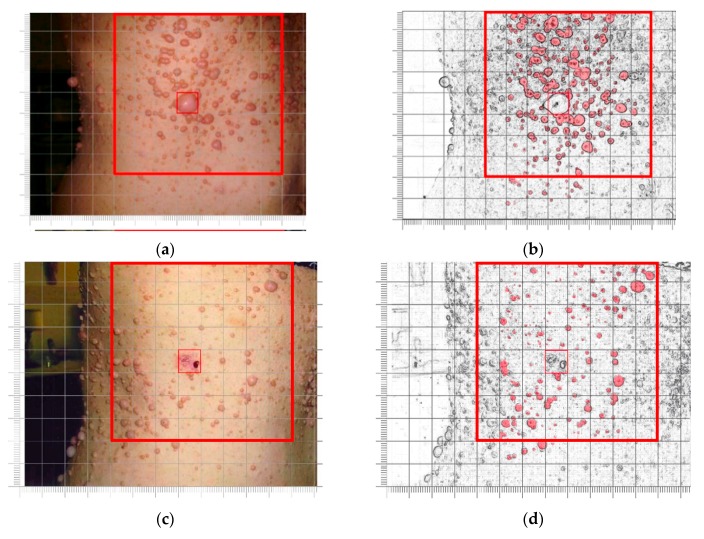
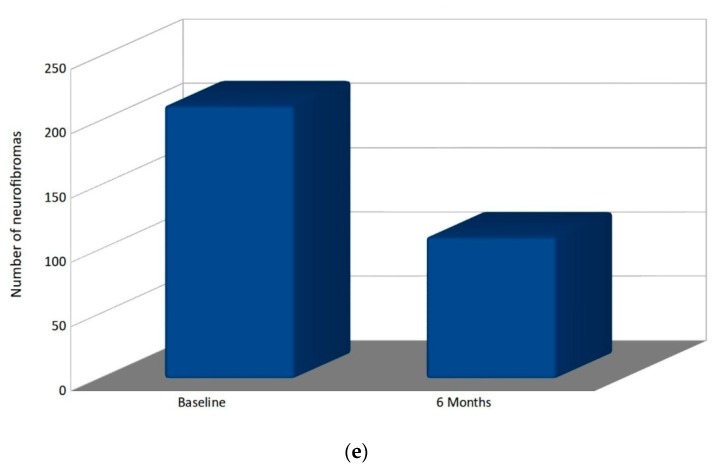
Figure 2.
Right lateral view of thoracic region in patient 9: serial clinical assessment. (a,c) The large red square outlines the sampled area at baseline (a) and after six months of MedDietCurcumin (c); the small red square indicates the most prominent neurofibroma in the area, which was removed immediately after baseline observation for histological examination; (b,d) Digital re-elaboration of the images in A and C to facilitate manual counting of cutaneous neurofibromas; (e) Bar chart representing the number of neurofibromas in the sampled area at baseline and at six-month follow-up.


