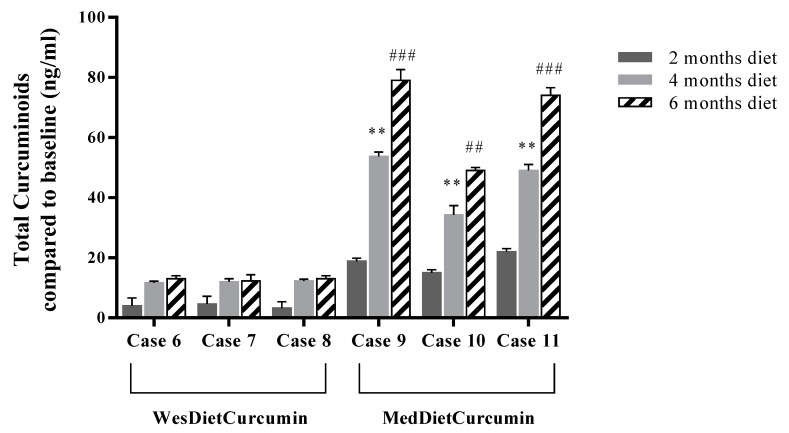
Figure 5.
Plasma levels of curcuminoids. HPLC analysis of enzymatically hydrolyzed plasma samples. For each sample, three different experiments were conducted and the results expressed as the mean of the values obtained (mean ± SD). Statistically significant variations: ** p < 0.01 4 months diet versus 2 months diet; ## p < 0.01 6 months diet versus 2 months diet; ### p < 0.001 6 months diet versus 2 months diet.

