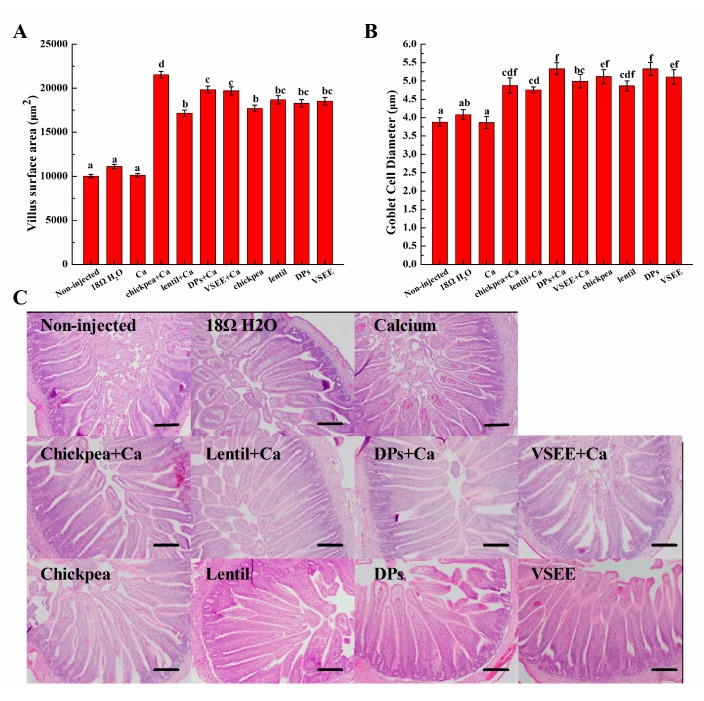
Figure 4.
Effect of intra-amniotic administration of experimental solutions on: (A) the duodenal small intestinal villus surface area; and (B) goblet cells diameters. A representation of intestinal morphology from five dependent experiments in each group is shown (C). Values are means ± SEM, n = 5. Standard errors are represented by vertical bars. a–f Treatments groups not indicated by the same letter are significantly different (p < 0.05). Bar = 100 µm.

