Fig. 1.

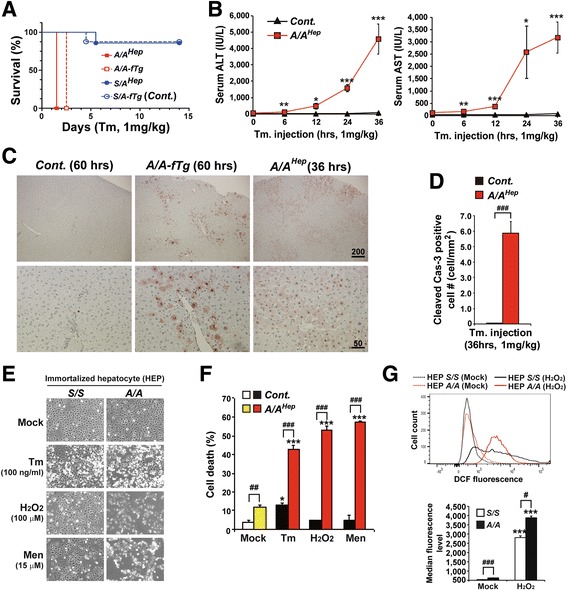
eIF2α phosphorylation protects hepatocytes from ER and oxidative stress. a The viability of the four experimental mouse groups (n = 10 per group) intraperitoneally injected with a chemical ER stress inducer (tunicamycin, Tm, 1 mg/kg body weight). Survival was followed for 14 days. b Serum ALT and AST levels measured at the indicated times after Tm injection. Data are means ± SEMs (n = 5 ~ 6 mice per group at each time point), *p < 0.05, **p < 0.01 and ***p < 0.001; Cont. vs A/A Hep. c TUNEL analysis performed on liver sections obtained from mice at the indicated times after Tm injection. Scale bars with scales (μm) have been inserted into the images. Representative images are shown (n = 6 mice per group). d Quantification of cleaved caspase-3-positive cells. Liver sections of Tm-challenged animals (36 h) were stained with antibody against cleaved caspase-3. Data are means ± SEM (n = 4 ~ 5 mice per group), ### p < 0.001; Cont. vs A/A Hep. e Morphology of immortalized embryonic wild type (HEP S/S) and mutant (HEP A/A) hepatocytes treated with Tm (100 ng/ml, 24 h) and inducers of reactive oxygen species (ROS) H2O2 (100 μM, 10 h) and menadione (Men, 15 μM, 6.5 h) at the indicated concentrations for 6.5 ~ 24 h. Representative images are shown. f Cell death (apoptotic and necrotic cells) determined by double staining with Hoechst 33258 and propidium iodide. Primary hepatocytes were isolated from control (Cont.) and A/A Hep mice, and exposed to the indicated chemicals (5 μg/ml Tm, 700 μM H2O2 and 6 μM Men) for 24 h. At least 500 cells were counted, and cell death is expressed as a percentage of total cells. Data are means ± SEM (n = 3 mice per each treatment), *p < 0.05 and ***p < 0.001; Mock vs Chemicals in the same genotype, ## p < 0.01 and ### p < 0.001; Cont. vs A/A Hep. g FACS measurement of hepatocyte ROS levels by staining with CM-H2DCFDA (upper panel). Wild type (HEP S/S) and mutant (HEP A/A) hepatocytes were treated with H2O2 (100 μM) for 10 h. The lower graph shows the average median fluorescence levels of three independent samples per group. Data are means ± SEM (n = 3 mice per each treatment), ***p < 0.001; Mock vs H2O2 in the same genotype, # p < 0.05 and ### p < 0.001; S/S vs A/A
