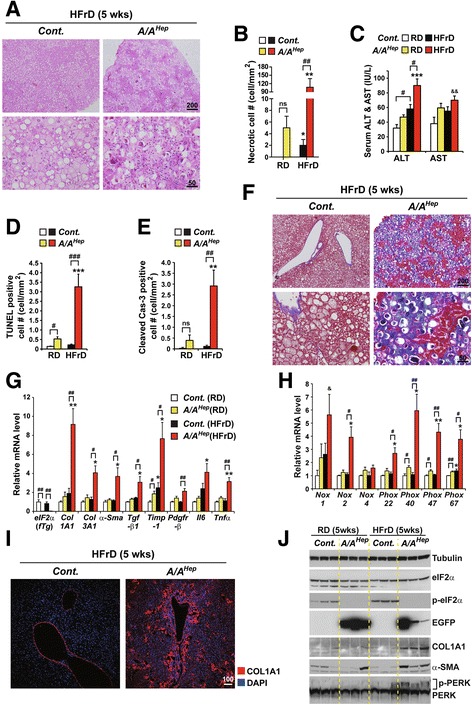
Fig. 2.

A high fructose diet (HFrD) accelerates hepatocyte cell death and fibrogenesis in hepatocyte-specific eIF2α phosphorylation-deficient middle-aged mice. a Hematoxylin and eosin (H&E)-stained images of liver tissue sections from 13-month-old Cont. and A/A Hep mice fed a 60% high fructose diet (HFrD) for 5 wks. Representative images are shown (n = 7 mice per group). b Quantification of anuclear necrotic cells in Masson’s trichrome stained liver sections (Additional file 4 e and Fig. 2f) of 13-month-old Cont. and A/A Hep mice fed a regular diet (RD) (n = 5 ~ 8 mice per group) or a 60% high fructose diet (HFrD) (n = 7 mice per group) for 5 wks. Data are means ± SEM; **p < 0.01; RD vs HFrD in the same genotype, # p < 0.05 and ## p < 0.01; Cont. vs A/A Hep. ns stands for no significant. c Serum ALT and AST levels in 13-month-old Cont. and A/A Hep mice fed an RD (n = 5 ~ 8 mice per group) or an HFrD (n = 7 mice per group) for 5 wks . Data are means ± SEM; ***p < 0.001; RD vs HFrD in the same genotype, # p < 0.05; Cont. vs A/A Hep. d and (e) Quantification of TUNEL positive cells (d) and cleaved caspase 3-positive cells (e) in liver tissue sections (Additional file 4 b and c) from 13-month-old Cont. and A/A Hep mice fed an RD (n = 5 ~ 8 mice per group) or an HFrD (n = 7 mice per group) for 5 wks. Data are means ± SEM; **p < 0.01 and ***p < 0.001; RD vs HFrD in the same genotype, # p < 0.05, ## p < 0.01 and ### p < 0.001; Cont. vs A/A Hep. ns stands for no significant. f Masson’s trichrome-stained images of liver tissue sections from 13-month-old Cont. and A/A Hep mice fed an HFrD for 5 wks. Representative images are shown (n = 7 mice per group). g and (h) Quantitative real-time PCR analysis of expression of selected genes ((eIF2α transgene, liver fibrosis-related genes, and inflammatory genes in Fig. 2g) and (NADPH oxidases and their components in Fig. 2h)) in livers of 13-month-old Cont. and A/A Hep mice fed an RD (n = 5 ~ 8 mice per group) or an HFrD (n = 7 mice per group) for 5 wks . Data are means ± SEM; *p < 0.05 and **p < 0.01; RD vs HFrD, # p < 0.05 and ## p < 0.01; Cont. vs A/A Hep , & p < 0.05; Cont.(RD) vs A/A Hep(HFrD). i Collagen AI (Col AI) immunofluorescence labeling of liver sections from 13-month-old mice fed an HFrD for 5 wks. Representative merged images of Col AI and DAPI are shown (n = 7 mice per group). j Western blot analysis of liver lysates from 13-month-old Cont. and A/A Hep mice fed an RD or an HFrD for 5 wks. The efficiency of deletion of floxed eIF2α fTg by Cre recombinase in A/A Hep livers was determined from the existence of phosphorylated eIF2α and EGFP proteins. To assess liver fibrogenesis, the levels of collagen AI (Col AI) and α-smooth muscle actin (α-SMA) in liver tissue were analyzed
