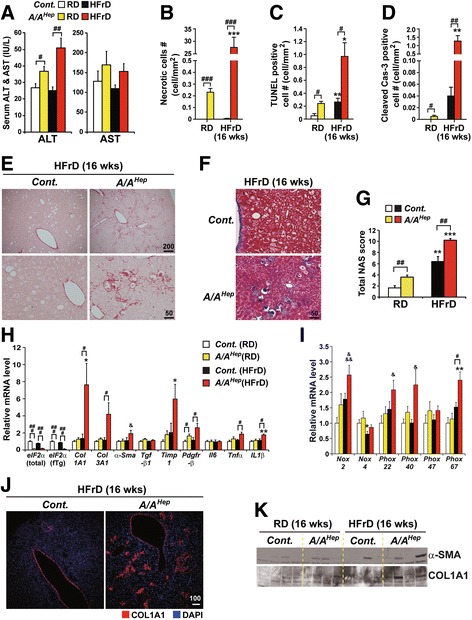
Fig. 3.

eIF2α phosphorylation in adult mice prevents hepatocyte death and hepatic fibrogenesis induced by long-term HFrD feeding. a Serum ALT and AST levels measured in 7-month-old Cont. and A/A Hep mice fed an RD or an HFrD for 16 wks. Data are shown as means ± SEM (n = 6 mice per group); # p < 0.05 and ## p < 0.01; Cont. vs A/A Hep. b Quantification of anuclear necrotic cells in the Masson’s trichrome-stained images of Fig. 4f and Additional file 6 d. Data are means ± SEM (n = 6 mice per group); ***p < 0.001; RD vs HFrD and ### p < 0.001; Cont. vs A/A Hep. c Quantification of TUNEL-positive cells in the images of Additional file 6 e. TUNEL staining in liver sections from 7-month-old Cont. and A/A Hep mice fed an RD or an HFrD for 16 wks. Data are means ± SEM (n = 6 mice per group); *p < 0.05 and **p < 0.01; RD vs HFrD, # p < 0.05; Cont. vs A/A Hep. d Quantification of cleaved caspase-3-positive cells in the images of Additional file 6 f. Immunohistochemical staining of cleaved caspase 3 in liver tissue sections from 7-month-old Cont. and A/A Hep mice fed an RD or an 60% HFrD for 16 wks. Data are means ± SEM (n = 6 mice per group); **p < 0.01; RD vs HFrD, # p < 0.05 and ## p < 0.01; Cont. vs A/A Hep. e and (f) Sirius red-stained images (e) and Masson’s trichrome-stained images (f) of liver tissue sections from 7 months-old Cont. and A/A Hep mice fed an RD or an HFrD for 16 wks. Representative images are shown (n = 6 mice per group). g Histological NAFLD activity scores (NAS) determined according to the NASH Clinical Research Network (CRN) scoring system. Data are means ± SEM (n = 6 mice per group); ## p < 0.01; Cont. vs A/A Hep, **p < 0.01 and ***p < 0.001; RD vs HFrD. h and (i) Quantitative real-time PCR analysis of expression of selected genes (eIF2α transgene and liver fibrosis-related genes in Fig. 3h) and (NADPH oxidases and their components in Fig. 3i)) in 7-month-old Cont. and A/A Hep livers after 16 wk. of RD or HFrD. Data are means ± SEM (n = 6 mice per group); *p < 0.05; RD vs HFrD, # p < 0.05 and ### p < 0.001; Cont. vs A/A Hep, & p < 0.05 and &&& p < 0.001; Cont.(RD) vs A/A Hep(HFrD). j Immunofluorescence staining of collagen AI (Col AI) in liver tissues from 7-month-old Cont. and A/A Hep mice fed an HFrD for 16 wks. Representative images are shown (n = 6 mice per group). k Western blot analysis of liver fibrogenesis indicators, α-smooth muscle actin (α-SMA) and collagen AI (Col AI) in liver tissues from 7-month-old Cont. and A/A Hep mice fed an RD or an HFrD for 16 wks
