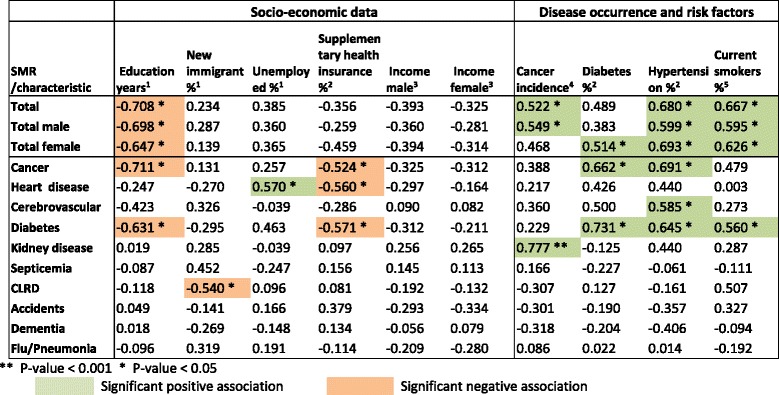
Table 4.
Pearson correlations of SMRs with socio-economic, disease and risk factors for 15 regions

Sources and definitions.
1 Calculated from CBS Labour force survey data, average for 2009–2011 for population aged 15 and over. Immigrants - from 1990. Unemployed: for last year.
2 CBS and MOH Health and social profile of localities, 2005–2009 [18], based on Health Survey, 2009, for ages 50–74, hypertension and diabetes prevalence (%).
3 CBS and MOH Health and social profile profile of localities, 2005–2009 [18], average monthly salary, 2009 National Insurance Institute data.
4 CBS and MOH Health and social profile profile of localities, 2005–2009 [18], based on Cancer Registry in Ministry of Health, average for 2005–2009 for all cancers, rate/100,000.
5 CBS Social survey, 2010, data for ages 20 and over
