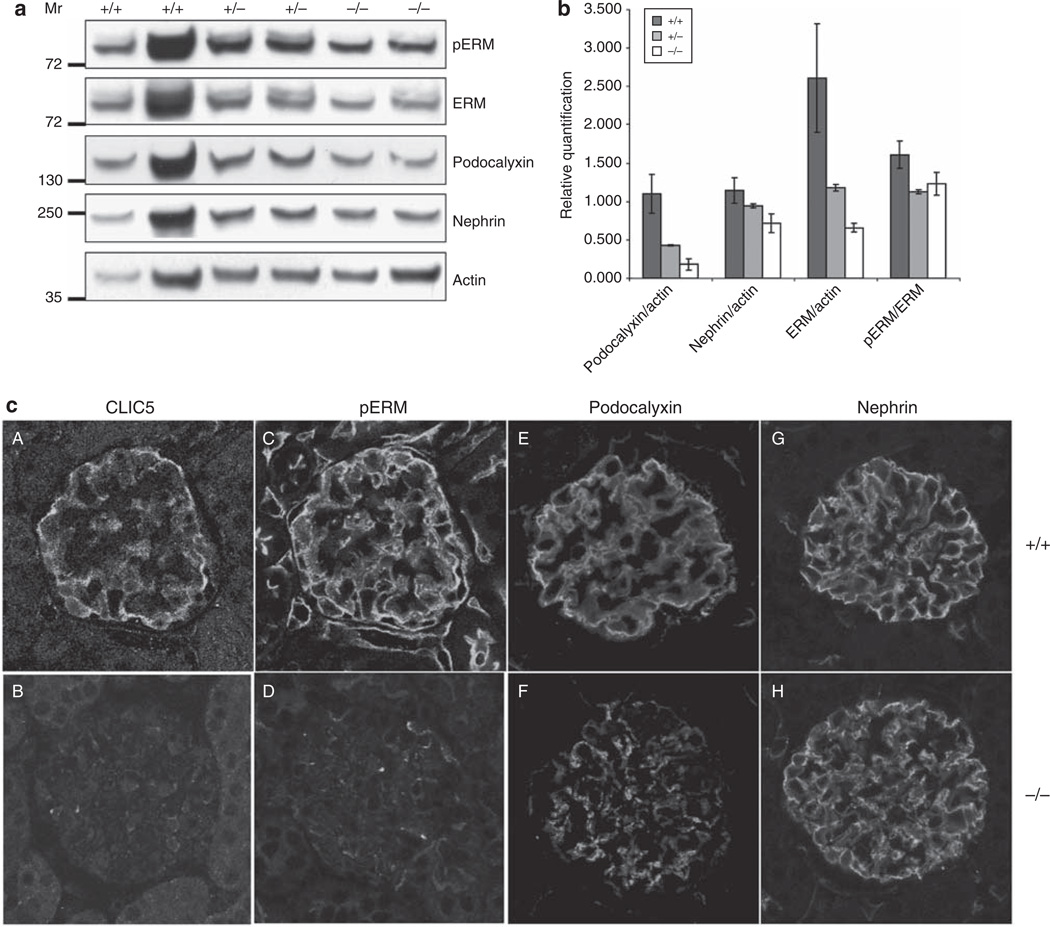
Figure 7. ERM and podocalyxin expression levels are dependent on chloride intracellular channel protein 5 (CLIC5).
(a) Western blot analysis was performed on whole cellular lysates (WCLs) derived from CLIC5+/+, CLIC5+/−, and CLIC5−/− glomeruli. pERM, total ERM, podocalyxin, and nephrin (labeled to the right of each blot) were detected using the appropriate antibodies, and immunoblotting for actin was performed to allow protein expression comparisons between each genotype. (b) To determine the relative protein expression levels, the signal intensities for ERM, podocalyxin, and nephrin were normalized to actin by densitometric analysis. To investigate whether the phosphorylation of the ERM protein complex differed between genotypes, a ratio of phosphorylated ERM to total ERM expression was calculated. Data were graphed as the mean ± range. No difference between genotypes was detected for the level of pERM compared with total ERM. However, there was more than a 1.5- and 2.5-fold decrease in the expression of total ERM in CLIC5+/− and CLIC5−/− mice, respectively, when compared with total ERM expression in CLIC5+/+ mice. Podocalyxin expression diminished by almost 1.5- and 3-fold for CLIC5+/− and CLIC5−/− mice, respectively. There was also a decrease in nephrin expression when CLIC5+/+ mice were compared with CLIC5−/− mice. (c) Images of glomeruli were obtained from kidney sections that were immunofluorescently labeled for CLIC5, pERM, podocalyxin, and nephrin. CLIC5+/+ glomeruli (A, C, E and G) and CLIC5−/− glomeruli (B, D, F and H).

