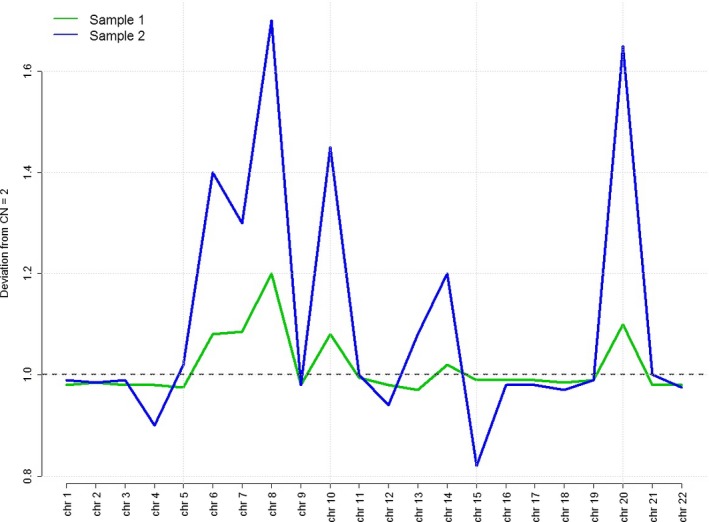
Figure 1.

Genome‐wide data from NIPS performed at 12 weeks (green line) and then repeated early third trimester (blue line). Multiple copy number variants are seen across the genome leading to the saw‐tooth pattern seen above, with increasing copy numbers of mapped sequences in the repeat sample. Both test results reported full or partial monosomy for chromosomes 13, 18, 21, and X, which was the result of the excess amounts of DNA sequences in chromosomes 7, 8, 10, 14, and 20 causing the bioinformatics algorithm to interpret the abnormal ratios as monosomies of the test chromosomes.
