Figure 2.

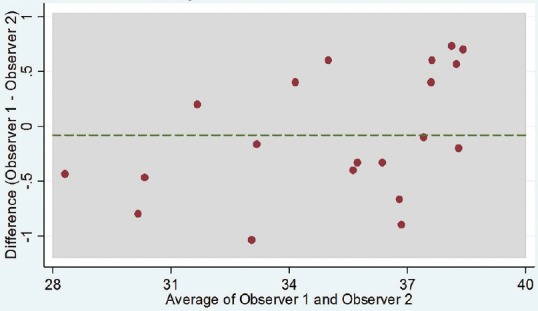
Bland–Altman plot showing inter-observer differences. None was outside the limits of agreement. The mean difference was −0.082 (95% confidence interval: −1.194–1.031)

Bland–Altman plot showing inter-observer differences. None was outside the limits of agreement. The mean difference was −0.082 (95% confidence interval: −1.194–1.031)