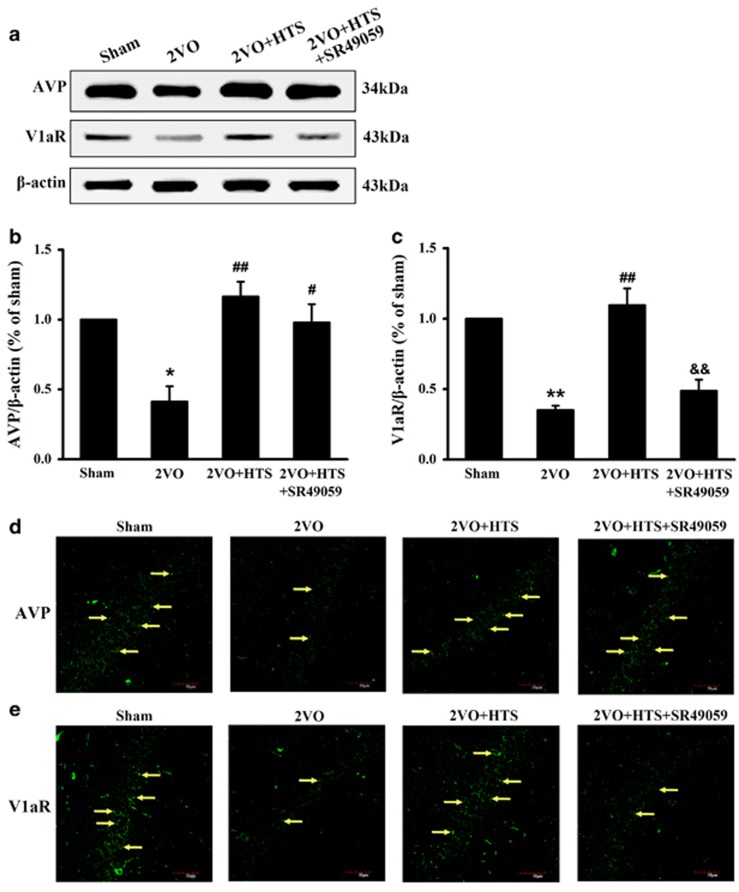
Figure 1.
The expressions of AVP and V1aR in hippocampus of sham, 2VO, 2VO + HTS and 2VO + HTS + SR49059 groups. (a) Representative immunoreactive bands of AVP (34 kDa), V1aR (43 kDa) and β-actin (43 kDa). Proteins lysed in RIPA were loaded at 30 μg per well. (b) Quantitative analysis of the optical density ratio of AVP/β-actin. (c) Quantitative analysis of the optical density ratio of V1aR/β-actin. Data are shown as mean ± s.e.m. *P<0.05, **P<0.01 versus sham group; #P<0.05, ##P<0.01 versus 2VO group; &&P<0.01 versus 2VO + HTS group (one-way ANOVA analysis followed by LSD test). n=4 per group. (d) Representative immunofluorescence photographs of AVP in the hippocampal CA1 region. Yellow arrows denote AVP expression. (e) Representative immunofluorescence photographs of V1aR in the hippocampal CA1 region. Yellow arrows denote V1a receptor expression. Scale bar=50 μm. ANOVA, analysis of variance; AVP, arginine vasopressin; HTS, hypertonic saline; LSD, least significant difference; 2VO, two vessel occlusion; VIaR, V1a receptor.

