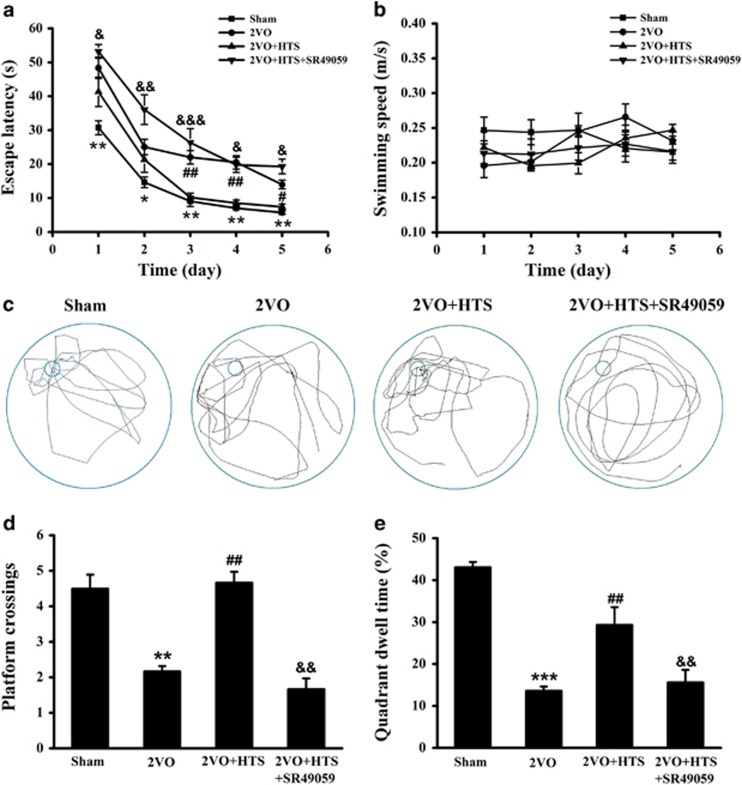
Figure 2.
The performance of rats in IT and SET stages of MWM experiment. (a) Calculated escape latency on each day in IT stage of sham, 2VO, 2VO + HTS and 2VO + HTS + SR49059 groups (two-way repeated measures ANOVA with LSD or Dunnett’s T3 post hoc test). (b) Swimming speeds on each day in the IT stage of four groups (two-way repeated measures ANOVA). (c) Representative swim traces of all four groups in SET stage. (d) The number of platform crossings in the SET stage (Mann–Whitney U-test). (e) Percentage of time spent in target quadrant (quadrant III) in SET stage (one-way ANOVA analysis followed by LSD test). Data are shown as mean±s.e.m. *P<0.05, **P<0.01, ***P<0.001 versus sham group; #P<0.05, ##P<0.01 versus 2VO group; &P<0.05, &&P<0.01, &&&P<0.001 versus 2VO + HTS group. n=8 per group. ANOVA, analysis of variance; HTS, hypertonic saline; IT, initial training; LSD, least significant difference; MWM, Morris water maze; SET, space exploring test; 2VO, two vessel occlusion.

