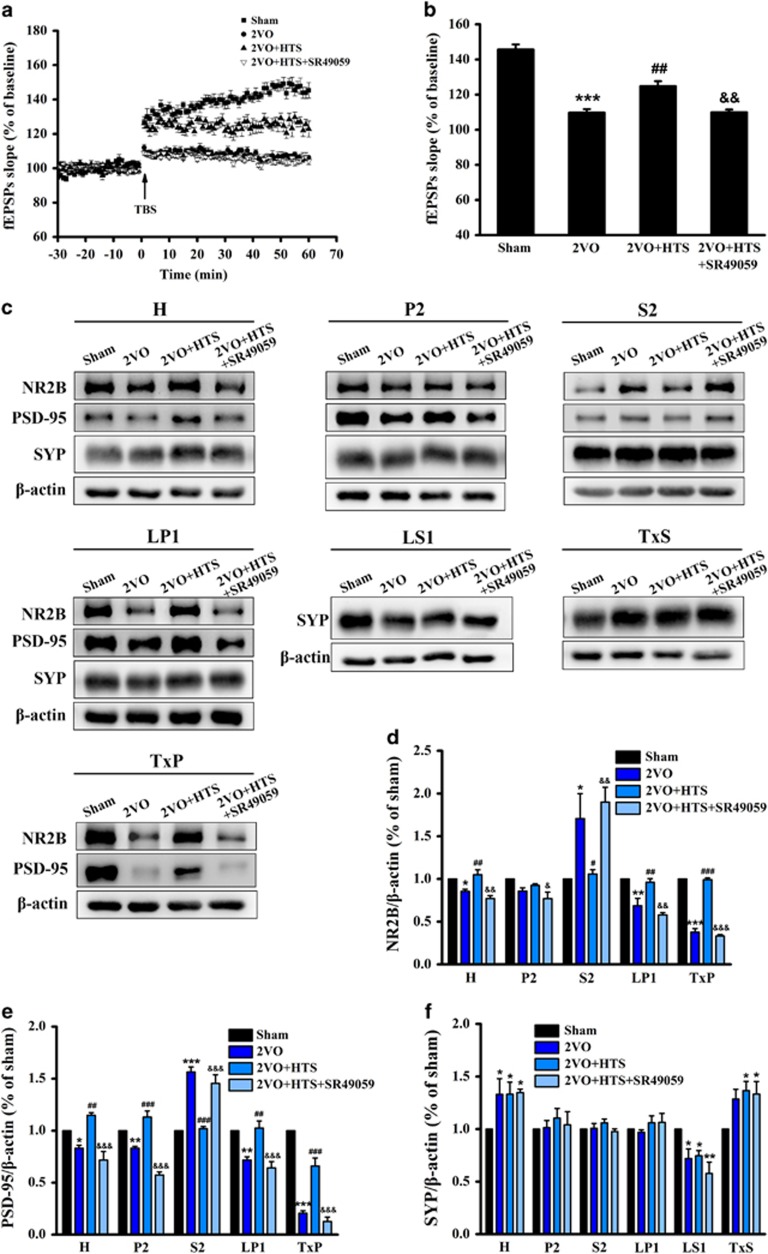
Figure 3.
Long-term potentiation (LTP) from Schaffer collaterals to the hippocampal CA1 and synaptic protein expressions in hippocampus of sham, 2VO, 2VO + HTS and 2VO + HTS + SR49059 groups. (a) The changes of time coursing in normalized fEPSP slopes in sham, 2VO, 2VO + HTS and 2VO + HTS + SR49059 groups. The first 30 min of evoked responses were normalised and used as the baseline responses of LTP. Arrow represents application of a theta burst stimulation (TBS). (b) The mean normalized fEPSP slopes between 45 and 60 min after the TBS. n=8 per group. (c) Representative immunoreactive bands of NR2B (180 kDa), PSD-95 (95 kDa), SYP (38 kDa) and β-actin (43 kDa) in different subcellular fractions. Proteins were loaded at 5 μg per well for the LS1, 10 μg per well for the H, P2, LP1, TxS and TxP and 30 μg per well for the S2. (d–f) Quantitative analysis of the optical density ratio of NR2B/β-actin (d), PSD-95/β-actin (e) and SYP/β-actin (f) in different subcellular fractions. Data are shown as mean±s.e.m. *P<0.05, **P<0.01, ***P<0.001 versus sham group; #P<0.05, ##P<0.01, ###P<0.001 versus 2VO group; &P<0.05, &&P<0.01, &&&P<0.001 versus 2VO + HTS group (one-way ANOVA analysis followed by LSD test). n=4 per group. ANOVA, analysis of variance; fEPSP, field excitatory postsynaptic potential; HTS, hypertonic saline; LSD, least significant difference; NR2B, N-methyl-D-aspartate receptor subunit 2B; PSD-95, postsynaptic density protein 95; 2VO, two vessel occlusion.

