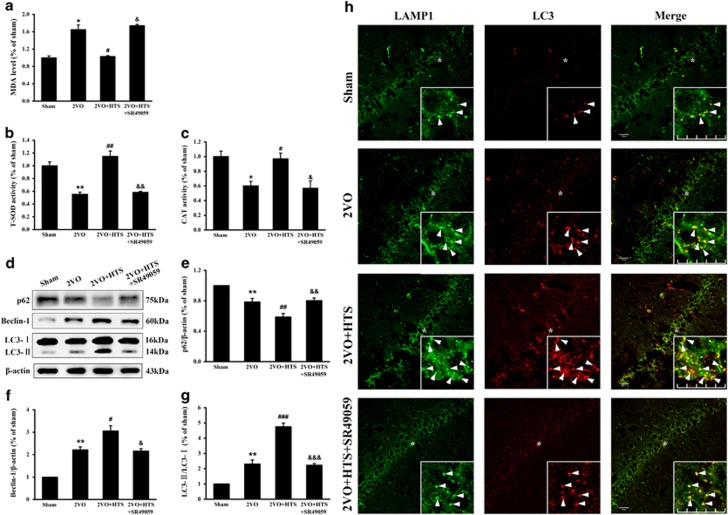
Figure 4.
The changes of oxidative parameters and autophagy levels in the hippocampus of sham, 2VO, 2VO + HTS and 2VO + HTS + SR49059 groups. (a) The MDA level in hippocampus of the four groups (Mann–Whitney U-test). (b) The T-SOD activity in hippocampus of the four groups (Mann–Whitney U-test). (c) The CAT activity in hippocampus of the four groups (one-way ANOVA analysis followed by LSD test). (d) Representative immunoreactive bands of SQSTM1/p62 (75 kDa), Beclin-1 (60 kDa), LC3-I (16 kDa), LC3-II (14 kDa) and β-actin (43 kDa). Proteins lysed in RIPA were loaded at 30 μg per well. (e–g) Quantitative analysis of the optical density ratio of p62/β-actin (e), Beclin-1/β-actin (f), and LC3-II/LC3-I (g; one-way ANOVA analysis followed by LSD test). Data are shown as mean±s.e.m. *P<0.05, **P<0.01 versus sham group; #P<0.05, ##P<0.01, ###P<0.001 versus 2VO group; &P<0.05, &&P<0.01, &&&P<0.001 versus 2VO + HTS group. n=4 per group. (h) Representative immunofluorescence photographs showed the co-localization of LC3 and LAMP1 in CA1 regions as indicated by yellow punctiform staining. Higher magnification views of the areas marked with ‘*’ were shown as insets. White arrows denote LC3, LAMP1 and merged punctas. Scale bar=50 μm. ANOVA, analysis of variance; CAT, catalase; HTS, hypertonic saline; LSD, least significant difference; MDA, malondialdehyde; T-SOD, total superoxide dismutase; 2VO, two vessel occlusion.

