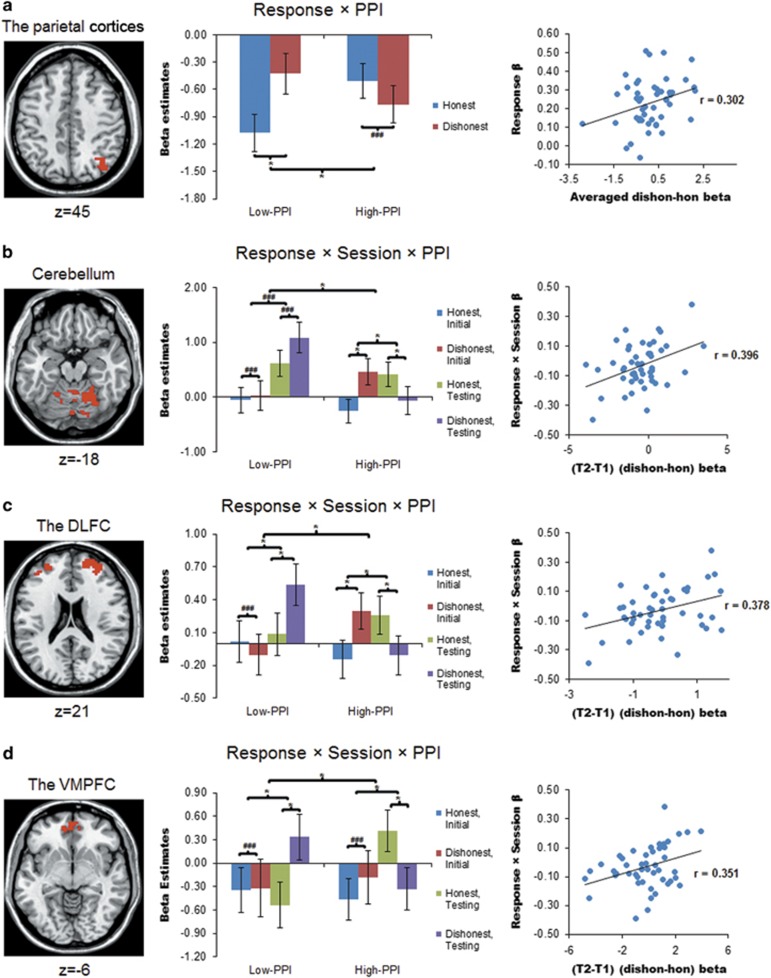
Figure 3.
Extracted parameter estimates (β-values) of significant clusters during cue processing for 48 participants (22 low-PPI). Signals were extracted from four a priori ROIs: the parietal cortices (a), the cerebellum (b), the dorsolateral frontal cortex (DLFC) (c) and the ventromedial prefrontal cortex (VMPFC) (d). Signals during processing honest or lying cues are displayed after subtracting signals during processing control task (CT) cues. This is to display signals of interest against an explicit CT baseline rather than against a more ambiguous ‘implicit’ baseline, but does not alter the statistical results. The significant clusters in each ROI are overlaid on a standard anatomical template (ch2). MNI z coordinates are provided below the axial slices. Within each scatter plot, the x axis denotes the beta values of neural signals, whereas the y axis denotes standardized β-values on behavioural RTs. *Indicates statistically significant effects at P<0.05, after Holm–Bonferroni correction for the number of ROIs. Parietal cortices: response × PPI Pcorr=0.001, if low-PPI, response effect Pcorr=0.003; cerebellum: response × session × PPI Pcorr<0.001; if high-PPI, response × session Pcorr<0.001, response effect at T1 Pcorr<0.001, response effect at T2 Pcorr=0.026; dorsolateral frontal cortex: response × session × PPI Pcorr<0.001; if low-PPI, response × session Pcorr=0.005, response effect at T2 Pcorr=0.003, if high-PPI, response × session Pcorr<0.001, response effect at T1 Pcorr=0.02, response effect at T2 Pcorr=0.026; VMPFC: response × session × PPI Pcorr<0.001, if low-PPI, response × session Pcorr=0.02, response effect at T2 Pcorr<0.001, if high-PPI, response × session Pcorr=0.02, response effect at T2 Pcorr=0.008. ###Indicates insignificant effects. Error bars represent ±1 standard error of the mean. dishon, dishonest cue; hon, honest cue; MNI, Montreal Neurological Institute; T1, initial session; T2, testing session. Please refer to text for details.

