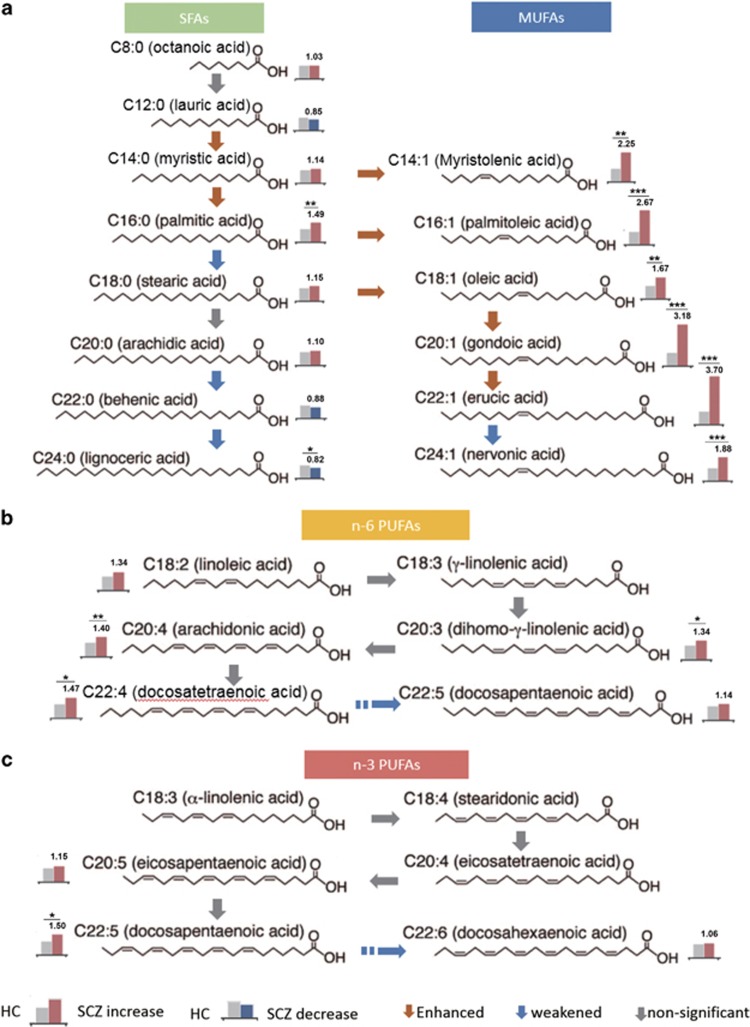
Figure 2.
Fatty acid (FA) elongation pathways differ between schizophrenia patients (SCZ) and healthy controls (HC). The FA elongation pathways of SFAs, MUFAs, n-3 PUFAs and n-6 PUFAs are illustrated. The histograms present the relative concentration of each free fatty acid (FFA) in HC (left) and SCZ (right, normalized by HC). Red histograms indicate increases in SCZ, whereas blue indicates decreases. The figure above the histogram is the fold change (FC), and asterisks indicate significance. The red arrows indicate a significant increase in the ratio of product: substrate, which was deduced to be enhanced in this direction. The blue arrows are the opposite and indicate ratios that were deduced to be weakened. The gray arrows indicate no statistical significance. a) The FA elongation pathways of SFAs and MUFAs. b) The FA elongation pathways of ω-6 PUFAs. c) The FA elongation pathways of ω-3 PUFAs.

