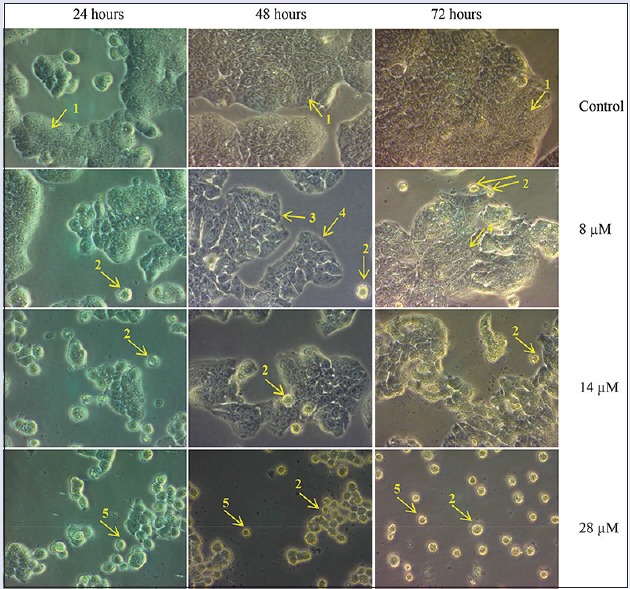
Figure 3.

Cell morphology examination of the HT29 cancer cell line by phase contrast microscopy at ×40. The cells were treated with 8 μM, 14 μM, or 28 μM rutamarin for 48 and 72 h. The arrows indicate: (1) A control cell, (2) apoptotic bodies, (3) cell shrinkage, (4) rounding of cells and (5) detached cells
