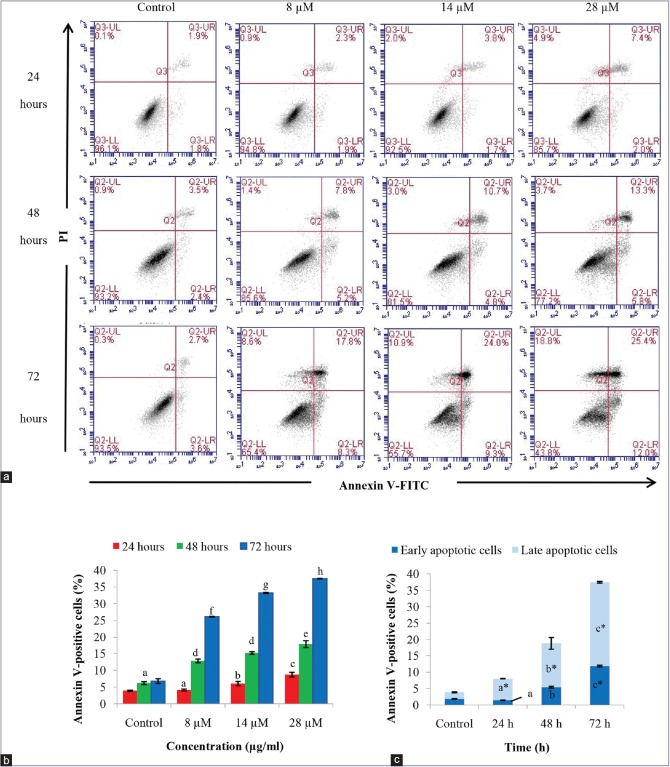
Figure 5.
(a) Annexin V/propidium iodide assay of the rutamarin-treated HT29 cell line by flow cytometry represented (b) in a bar chart form and (c) analyzed at the concentration of 28 μM. The results are expressed as the means ± standard deviation, the different letters (a-h) represent a significant difference between different time points of treatment whereas the asterisk in (c) represents a significant difference compared to untreated control in 0.5% dimethyl sulfoxide, P < 0.05

