Figure 6.

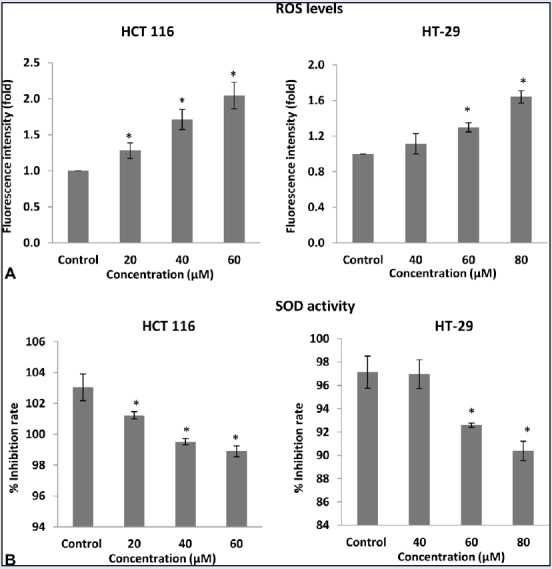
Concentration-dependent effect of FKC on ROS generation (A) and SOD activity (B) in HCT 116 and HT-29 cells. The data are presented as the mean ± standard deviation for three independent experiments. * P<0.05 compared to control.

Concentration-dependent effect of FKC on ROS generation (A) and SOD activity (B) in HCT 116 and HT-29 cells. The data are presented as the mean ± standard deviation for three independent experiments. * P<0.05 compared to control.