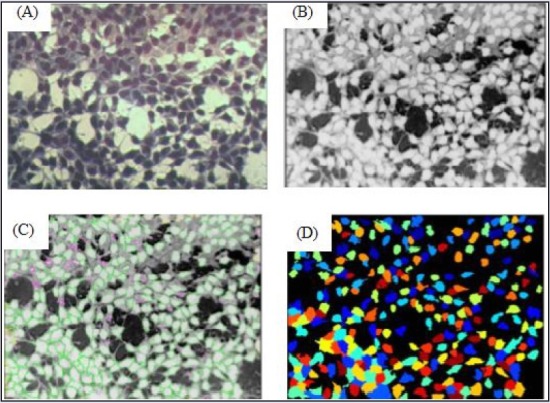
Figure 1.

Cell identification with the CellProfiler® pipeline Figure 1: (A) The original image. (B) Image converted to grayscale. (C) In green, identified cells according to the established parameters (size and shape); in pink cells deleted (because are not within the parameters). (D) Cells identified from picture c, each colored point represents one identified cell
