Figure 3.

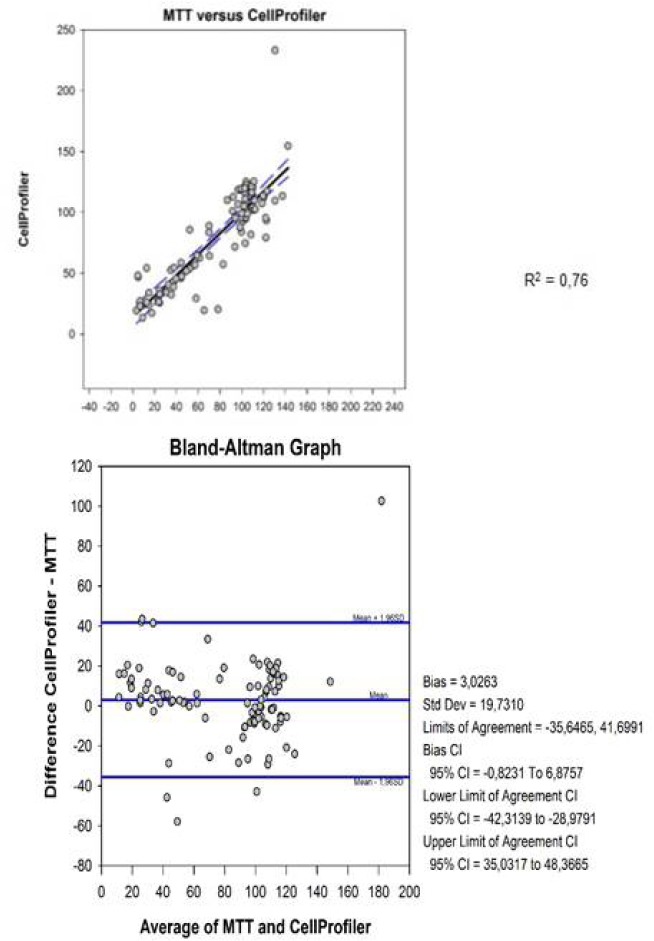
Statistical analysis with Bland-Altman plot Figure 3: This figure shows the correlation of cell viability as calculated by CellProfiler® and MTT assay

Statistical analysis with Bland-Altman plot Figure 3: This figure shows the correlation of cell viability as calculated by CellProfiler® and MTT assay