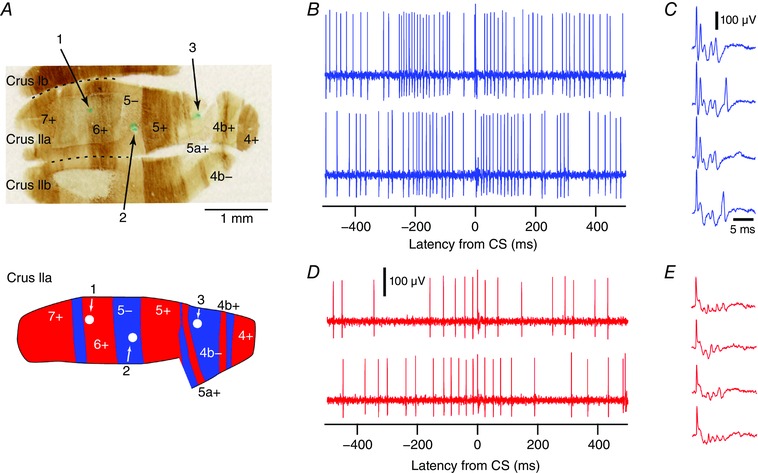
Figure 1. Localization of PCs and recordings of Z+ and Z− PC activity.

A, top, zebrin‐stained histological section through lobules crus Ib, IIa and IIb. Numbers on section indicate zebrin bands. Numbered arrows point to alcian blue injections that were made at three sites of PC recordings. Bottom, schematic diagram showing location of the three cells in zebrin bands 6+, 5− and 4b−. B–D, sample extracellular records from Z− (B and C) and Z+ (D and E) PCs. B and D, records chosen to show the standard pattern of SS modulation observed in CS triggered histograms for Z− and Z+ PCs (see Fig. 2). Records aligned to the onset of the CS (latency = 0 ms). C and E, sample CSs from the Z− and Z+ PCs in B and D, respectively, displayed at a faster time scale to show the spikelet content of the CS. The colour conventions used in this figure (Z−, blue and Z+, red) are also used in all subsequent figures. [Color figure can be viewed at wileyonlinelibrary.com]
