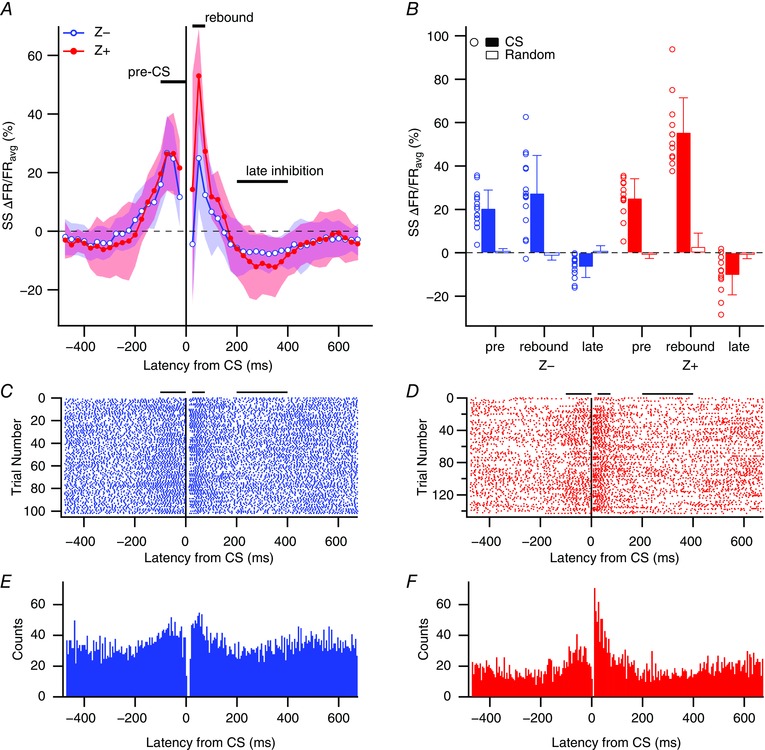
Figure 2. CS‐associated changes in SS activity.

A, percentage change in SS firing rate from average firing rate (ΔFR/FRavg) for 50 ms windows relative to CS onset (t = 0 ms). Data points are the mean changes for the Z− (blue, unfilled circles) and Z+ (red, filled circles) populations at each time window, and are plotted at the centre time of the corresponding window. The lighter shaded regions show the SD about the means. The three main analysis periods (pre‐CS, rebound and late inhibition) are defined by horizontal lines in A. Note that the window from −25 to 25 ms was not plotted as it would contain a mix of pre‐ and post‐CS activity as well as the CS itself. B, plot of ΔFR/FRavg values for Z+ and Z− cells for the three epochs defined in A. Circles show individual cell values. Filled bars indicate the population average ΔFR/FRavg values for each epoch. Unfilled bars show population averages obtained using randomized spike trains in place of CS data. For each cell, a randomized spike train was generated with the same number of spikes as CSs for the cell. These random spikes were used to generate the individual cell spike‐triggered histograms of SS activity from which the ΔFR/FRavg values were calculated. Error bars indicate 1 SD in this and all subsequent figures. C and D, CS‐triggered rasters of SS activity for a Z− (C) and Z+ (D) PC. Horizontal bars above the rasters define the three analysis periods. E and F, CS‐triggered histograms of SS activity for the PCs whose rasters are shown in C and D. [Color figure can be viewed at wileyonlinelibrary.com]
