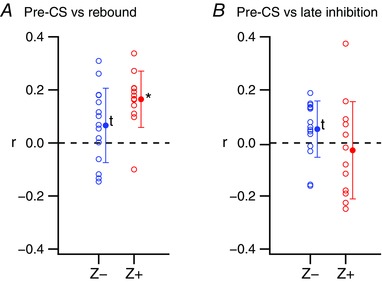
Figure 4. Spike by spike correlation of pre‐ and post‐CS modulation of SS activity.

The ΔFR/FRavg in the pre‐ and post‐CS periods were correlated across all CSs for individual PCs. The individual PC r‐values (open circles) and population averages (filled circles) are plotted. A, correlation of ΔFR/FRavg values in the pre‐CS and rebound periods. B, correlation of ΔFR/FRavg values in the pre‐CS and late inhibition periods. *Statistical significance (P < 0.05); t indicates a trend toward significance (0.05 < P < 0.10). [Color figure can be viewed at wileyonlinelibrary.com]
