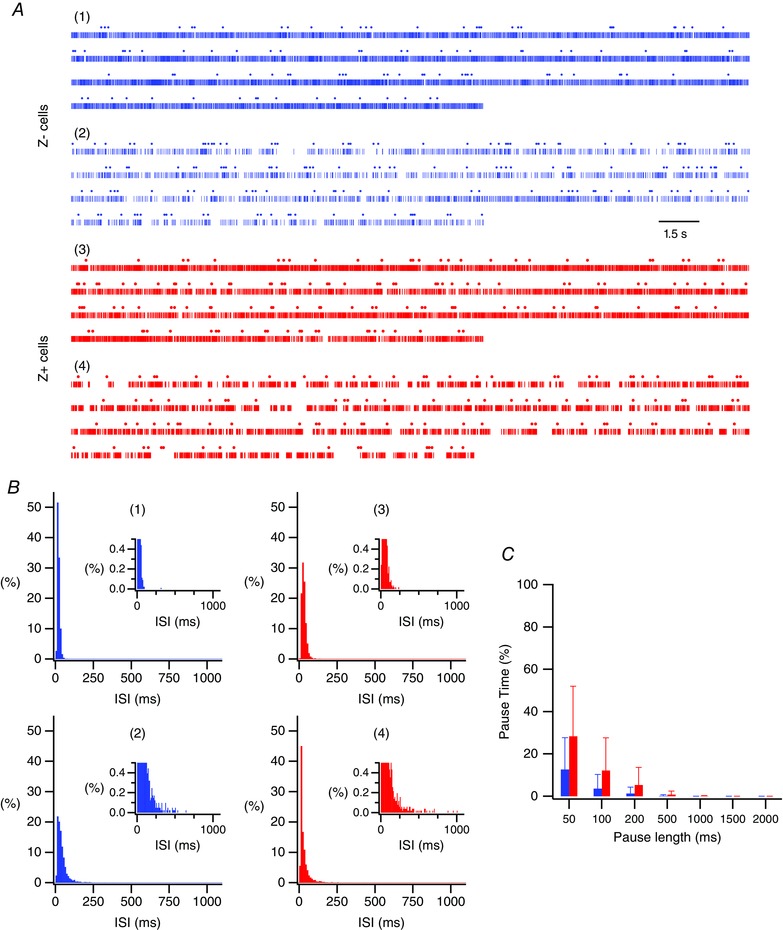
Figure 5. Absence of bistability firing patterns in the recordings.

A, raster display of spike trains from four PCs. SSs plotted as vertical lines and CSs as small circles above the SS records. Records 1 and 3 show typical Z− and Z+ trains and records 2 and 4 show trains from the Z− and Z+ PCs showing the largest number of long ISIs. Note that even the longest ISIs are much shorter than 1.5 s. B, ISI histograms from cells 1–4 shown in A. Insets have an expanded y‐axis to show the counts of the longer ISIs. C, the percentage of the total recording time accounted for by ISIs of a specific duration or greater is plotted for ISIs of 50 ms or greater, as indicated on the x‐axis. Pause time percentages were calculated by summing all ISIs of the specified duration or longer and dividing by the recording time. Bars represent averages of the Z− (left bars at each pause length) and Z+ (right bars at each pause length) populations. [Color figure can be viewed at wileyonlinelibrary.com]
