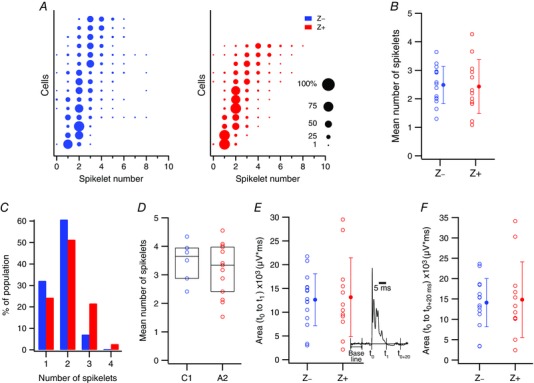
Figure 6. Z− and Z+ PCs have similar total spikelet number distributions.

A, distribution of spikelets for each cell recorded at the PC layer and localized to a specific zebrin band. Each row of circles represents the spikelet distribution for a single PC. Circle areas are proportional to the percentage of CSs of a cell having a particular number of spikelets. The distributions are arranged from bottom to top according to their mean spikelet number. B, mean number of spikelets/CS for each PC (open circles). Filled circles show population averages. C, distribution of spikelet numbers for average CS waveforms of PCs recorded by electrodes implanted to the mid molecular layer (dendritic CSs). Z− data is plotted as the left bar and Z+ as the right bar for each spikelet number. D, the mean number of spikelets/CS is plotted for each C1 and A2 cell as a blue (Z−) or red (Z+) circle. Horizontal bar and box give population median and interquartile range. E and F, overall size of CS, as quantified using the area under the CS waveform from its onset (t 0) until its termination defined either as when the recording trace returned to baseline (t 1) (E) or 20 ms after the onset of the CS (t 0+20ms) (F). Cells are from the zebrin‐localized PC layer recordings. Individual PC data (unfilled circles) and population averages (filled circles) are plotted. Inset in E displays an averaged trace of CSs from a PC to show the various parameters that were used to quantify the shape of the CS waveform. [Color figure can be viewed at wileyonlinelibrary.com]
