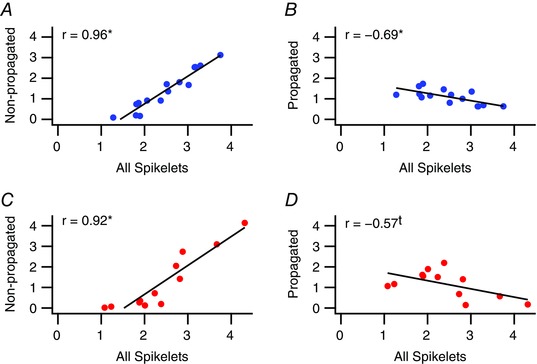
Figure 8. Variations in total spikelet numbers between PCs are correlated with variations in the number of likely non‐propagated spikelets.

Scatterplots of the average total number of spikelets of a PC vs. the average number of likely non‐propagated (A and C) and likely propagated (B and D) spikelets. *Statistical significance (P < 0.05); t indicates a trend toward significance (0.05 < P < 0.10). [Color figure can be viewed at wileyonlinelibrary.com]
