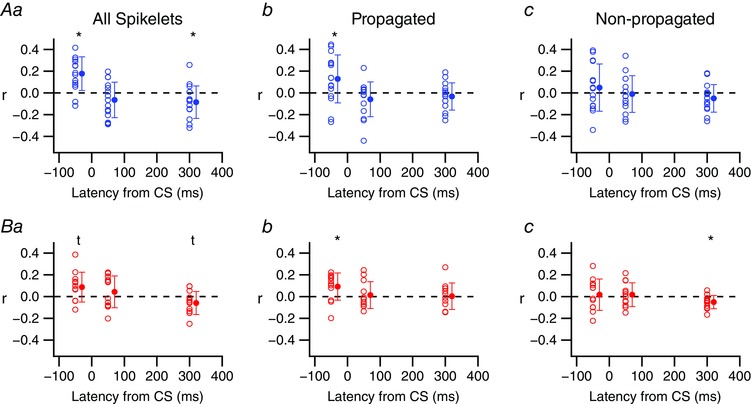
Figure 11. CS‐associated modulation of SS activity is sometimes correlated with spikelet numbers.

Plots of the CS by CS correlation of spikelet number with the ΔFR/FRavg for the pre‐CS (−50 ms), rebound (50 ms) and late inhibition (300 ms) periods. Unfilled circles show individual PC r‐values. Filled circles are population averages. *Statistical significance (P < 0.05); t indicates a trend toward significance (0.05 < P < 0.10). [Color figure can be viewed at wileyonlinelibrary.com]
