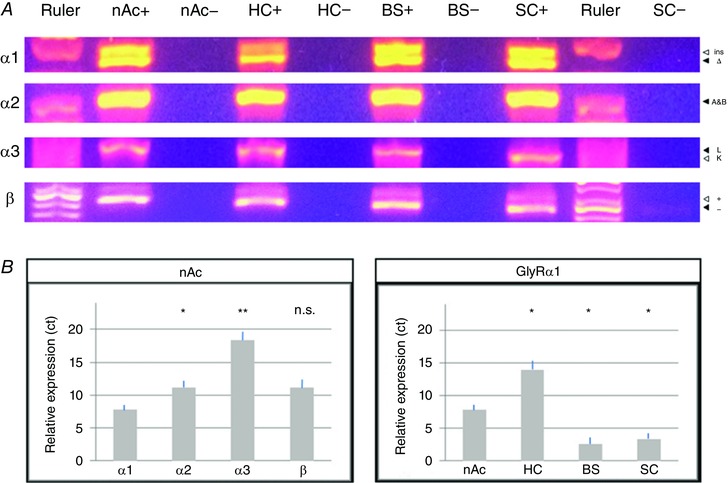
Figure 2. Conventional PCR and qPCR identify different GlyR subunits in the nAc.

A, qPCR products confirm the finding of conventional PCR amplification of GlyR splice variants from nucleus accumbens (nAc), hippocampus (HC), brainstem (BS) and spinal cord (SC). Positive (+) and cDNA‐free negative controls (−) showed that both splice variants of all tested GlyR subunits are expressed in nAc resulting in two distinct bands (α2A and β cannot be distinguished by size), although GlyR α3 expression is very low. GlyR α1Δ, α2A and α3L were more prevalent than their respective counterparts. B, quantitative real‐time PCR of GlyR in nAc of DRD1/GFP mice indicates that α1 is the predominantly expressed subunit in nAc. Comparison of GlyR α1 expression in nAc, HC, BS and SC show that it was expressed at similar levels in BS and SC, but lower in nAc and HC. Threshold cycles (ct) were normalized to GAPDH and primer efficiency was accounted for (values are mean ± SEM; n = 4; Kruskal–Wallis and unpaired post hoc Bonferroni t test: ** P < 0.01, * P < 0.05, n.s. not significant).
