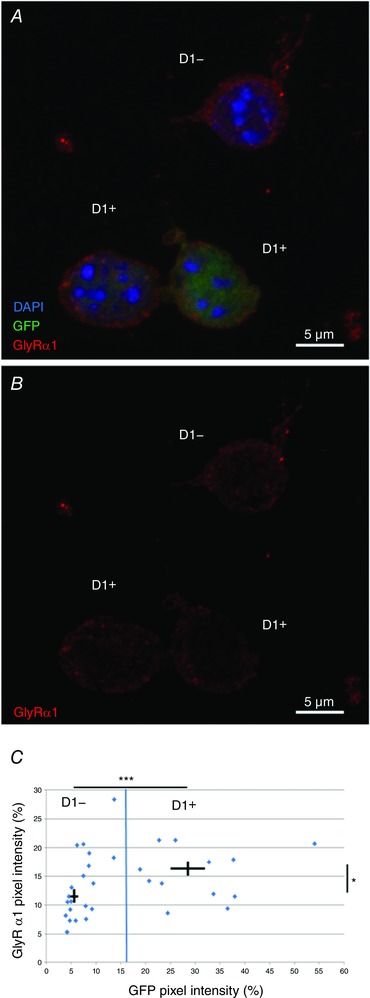
Figure 5. Immunocytochemistry showing GlyR α1 expression in acutely dissociated neurons from nAc.

A, maximum intensity projection z‐stack (z = 16; 7.23 μm) of acutely dissociated GFP‐positive D1+ and negative D1− cells showing DAPI (blue), GFP (green) and GlyR α1 (red). B, maximum intensity projection of GlyR α1 (red) only in acutely dissociated D1+ and D1− cells as shown in A. C, normalized GFP and GlyR α1 immunofluorescence in dissociated neurons. Blue line indicates cut‐off between cell types at the mean GFP signal. Cross‐bars indicate mean ± SEM for D1+ and D1− cells. Intensity was measured at an optical section at the cell centre (n = 14 and n = 19, respectively, GlyR vs. GlyR * P < 0.05, GFP vs. GFP *** < 0.001, unpaired Student's t test).
