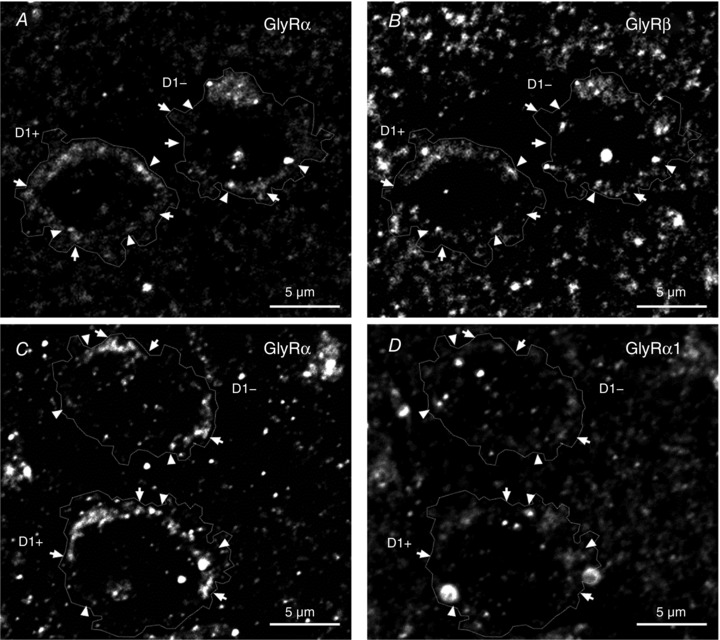
Figure 6. Presence of GlyR α and β subunits in D1+ and D1− MSNs of nAc brain sections.

A and B, immunohistochemistry of GlyR pan‐α (A) and GlyR β (B) shows that some clusters of GlyR α co‐localized with or are in close apposition to GlyR β (arrowheads) in D1+ and D1− cells in mouse brain sections of nAc (GFP and DAPI signal not shown). Some clusters were also found without presenting this co‐localization pattern (arrows). C and D, immunohistochemistry of GlyR pan‐α (C) and GlyR α1 (D) in mouse brain sections of nAc. The image shows co‐localization and apposition of GlyR α1 and pan‐α (arrowheads) and other pan‐α signals not co‐localized with α1 signal (arrows) in D1+ and D1− cells (GFP and DAPI signal not shown). Channel intensity of GlyR pan‐α was adjusted to be comparable to GlyR β and α1, respectively.
