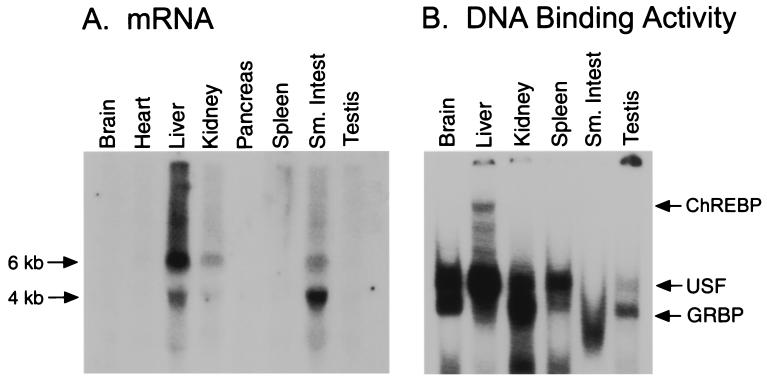
Figure 2.
(A) Tissue distribution of ChREBP as determined by Northern blot analysis. Message levels were visualized from total RNA (25 μg) with a 32P-radiolabeled probe derived from the ChREBP cDNA. (B) ChREBP activity is detected only in liver nuclear extracts. Nuclear extracts were prepared from rats re-fed a high carbohydrate diet for 24 h after 48-h starvation and incubated with the 32P-radiolabeled WT oligonucleotide (Table 1) followed by gel-shift analysis. Arrows indicate the positions of the DNA-binding complexes containing USF or GRBP as determined by supershift of the DNA-binding complex with antibodies specific for each protein.

