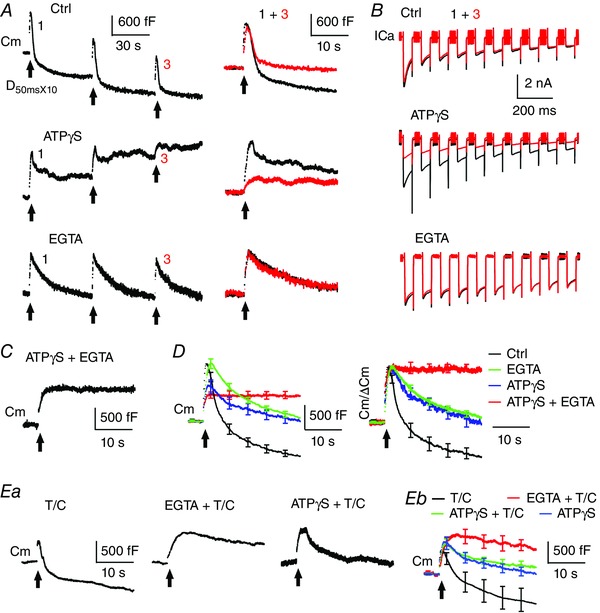
Figure 3. ATP‐independent endocytosis is correlated with endocytosis of pre‐existing membrane.

A, left: sampled Cm responses to three consecutive depol50msX10 recorded at calyces under dialysis with control pipette solution, 4 mm ATPγS or 20 mm EGTA. Right: Cm responses to the first and third depol50msX10 are superimposed to demonstrate depression of endocytosis in control and ATPγS but not in EGTA. EGTA blocked depression by preventing use‐dependent depletion of pre‐existing membrane over stimulation. Bath solution contained 6 mm Ca2+ for all experiments. B, sampled ICa recordings evoked by the first and third depol50msX10. Note that ATPγS did not affect ICa during initial pulses but reduced ICa during subsequent pulses and trains. C, sampled Cm responses to depol50msX10 recorded at a calyx under dialysis with ATPγS and EGTA. D, average Cm traces without (left) and with normalization to ΔCm (right). Both ATPγS and EGTA partially inhibited endocytosis induced by depol50msX10, whereas their co‐dialysis abolished endocytosis. Only responses to the first depol50msx10 are analysed. E, sampled Cm responses to depol50msX10 recorded from calyces under dialysis with the light chain of botulinum toxin C (T/C, 0.5 μm), EGTA and T/C, or ATPγS and T/C. Eb, average Cm traces from these treatments are superimposed. Error bars indicate the SEM. Note that T/C reduced exocytosis and thus highlighted endocytosis of pre‐existing membrane, which is blocked by EGTA but not ATPγS. Each test condition contains five to nine calyces.
