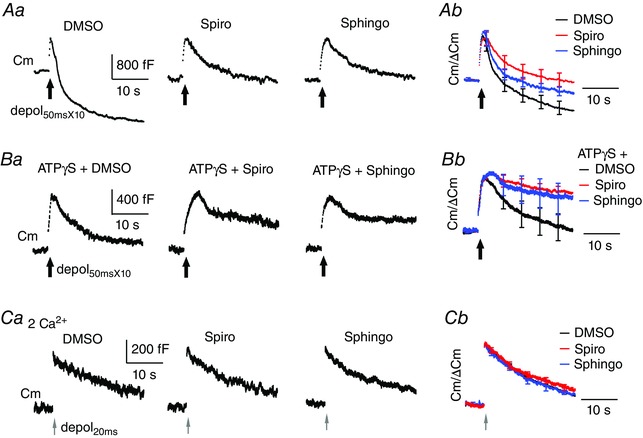
Figure 5. Inhibitors of nSMase impair ATP‐independent endocytosis.

A and B, sampled (left) and average (right) Cm responses to depol50msX10 under dialysis with DMSO (0.1%, n = 12), 10 μm spiroepoxide (Spiro, n = 12), 30 μm sphingolactone‐24 (Sphingo, n = 9), 4 mm ATPγS with DMSO (n = 11), ATPγS with spiroepoxide (n = 10) or ATPγS with sphingolactone‐24 (n = 11). Bath Ca2+ was 6 mm. C, sampled Cm (left) and average (right) responses to depol20ms under dialysis with DMSO (n = 9), spiroepoxide (n = 11) or sphingolactone‐24 (n = 11). Bath Ca2+ was 2 mm.
