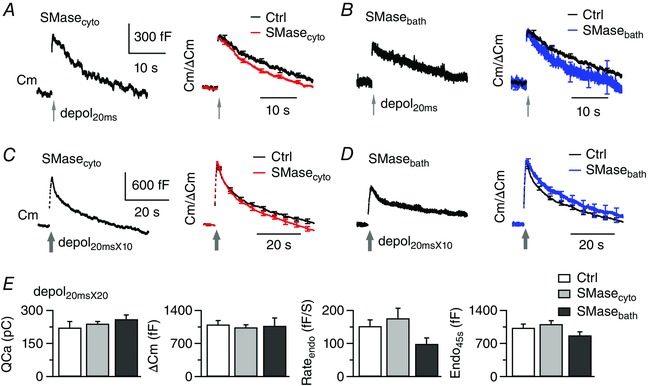
Figure 6. Exogenous SMase does not significantly affect compensatory endocytosis.

A, sampled Cm responses to depol20ms under dialysis with SMase (SMasecyto: 1 U ml−1, left). Right: superimposed Cm traces after normalization to ΔCm (n = 12 for SMasecyto). Control (n = 7) is from Fig. 2 A. Bath Ca2+ was 2 mm. B, similar to (A), except that this calyx was exposed to SMase in the bath for > 30 min (1 U ml−1, left). Average results are from six calyces exposed to bath SMase. C and D, similar to the description in (A) to (B) except that calyces were stimulated with depol20msX10. E, comparison of QCa, ΔCm, Rateendo and Endo45s for control (n = 10 from Fig. 1 C), SMasecyto (n = 11) and SMasebath (n = 9). [Color figure can be viewed at wileyonlinelibrary.com]
